Why are my NO₂ measurements missing a calibration?
Why are some devices with the NO₂ global model occasionally unable to produce calibrated measurements?
How to identify missing-calibration measurements
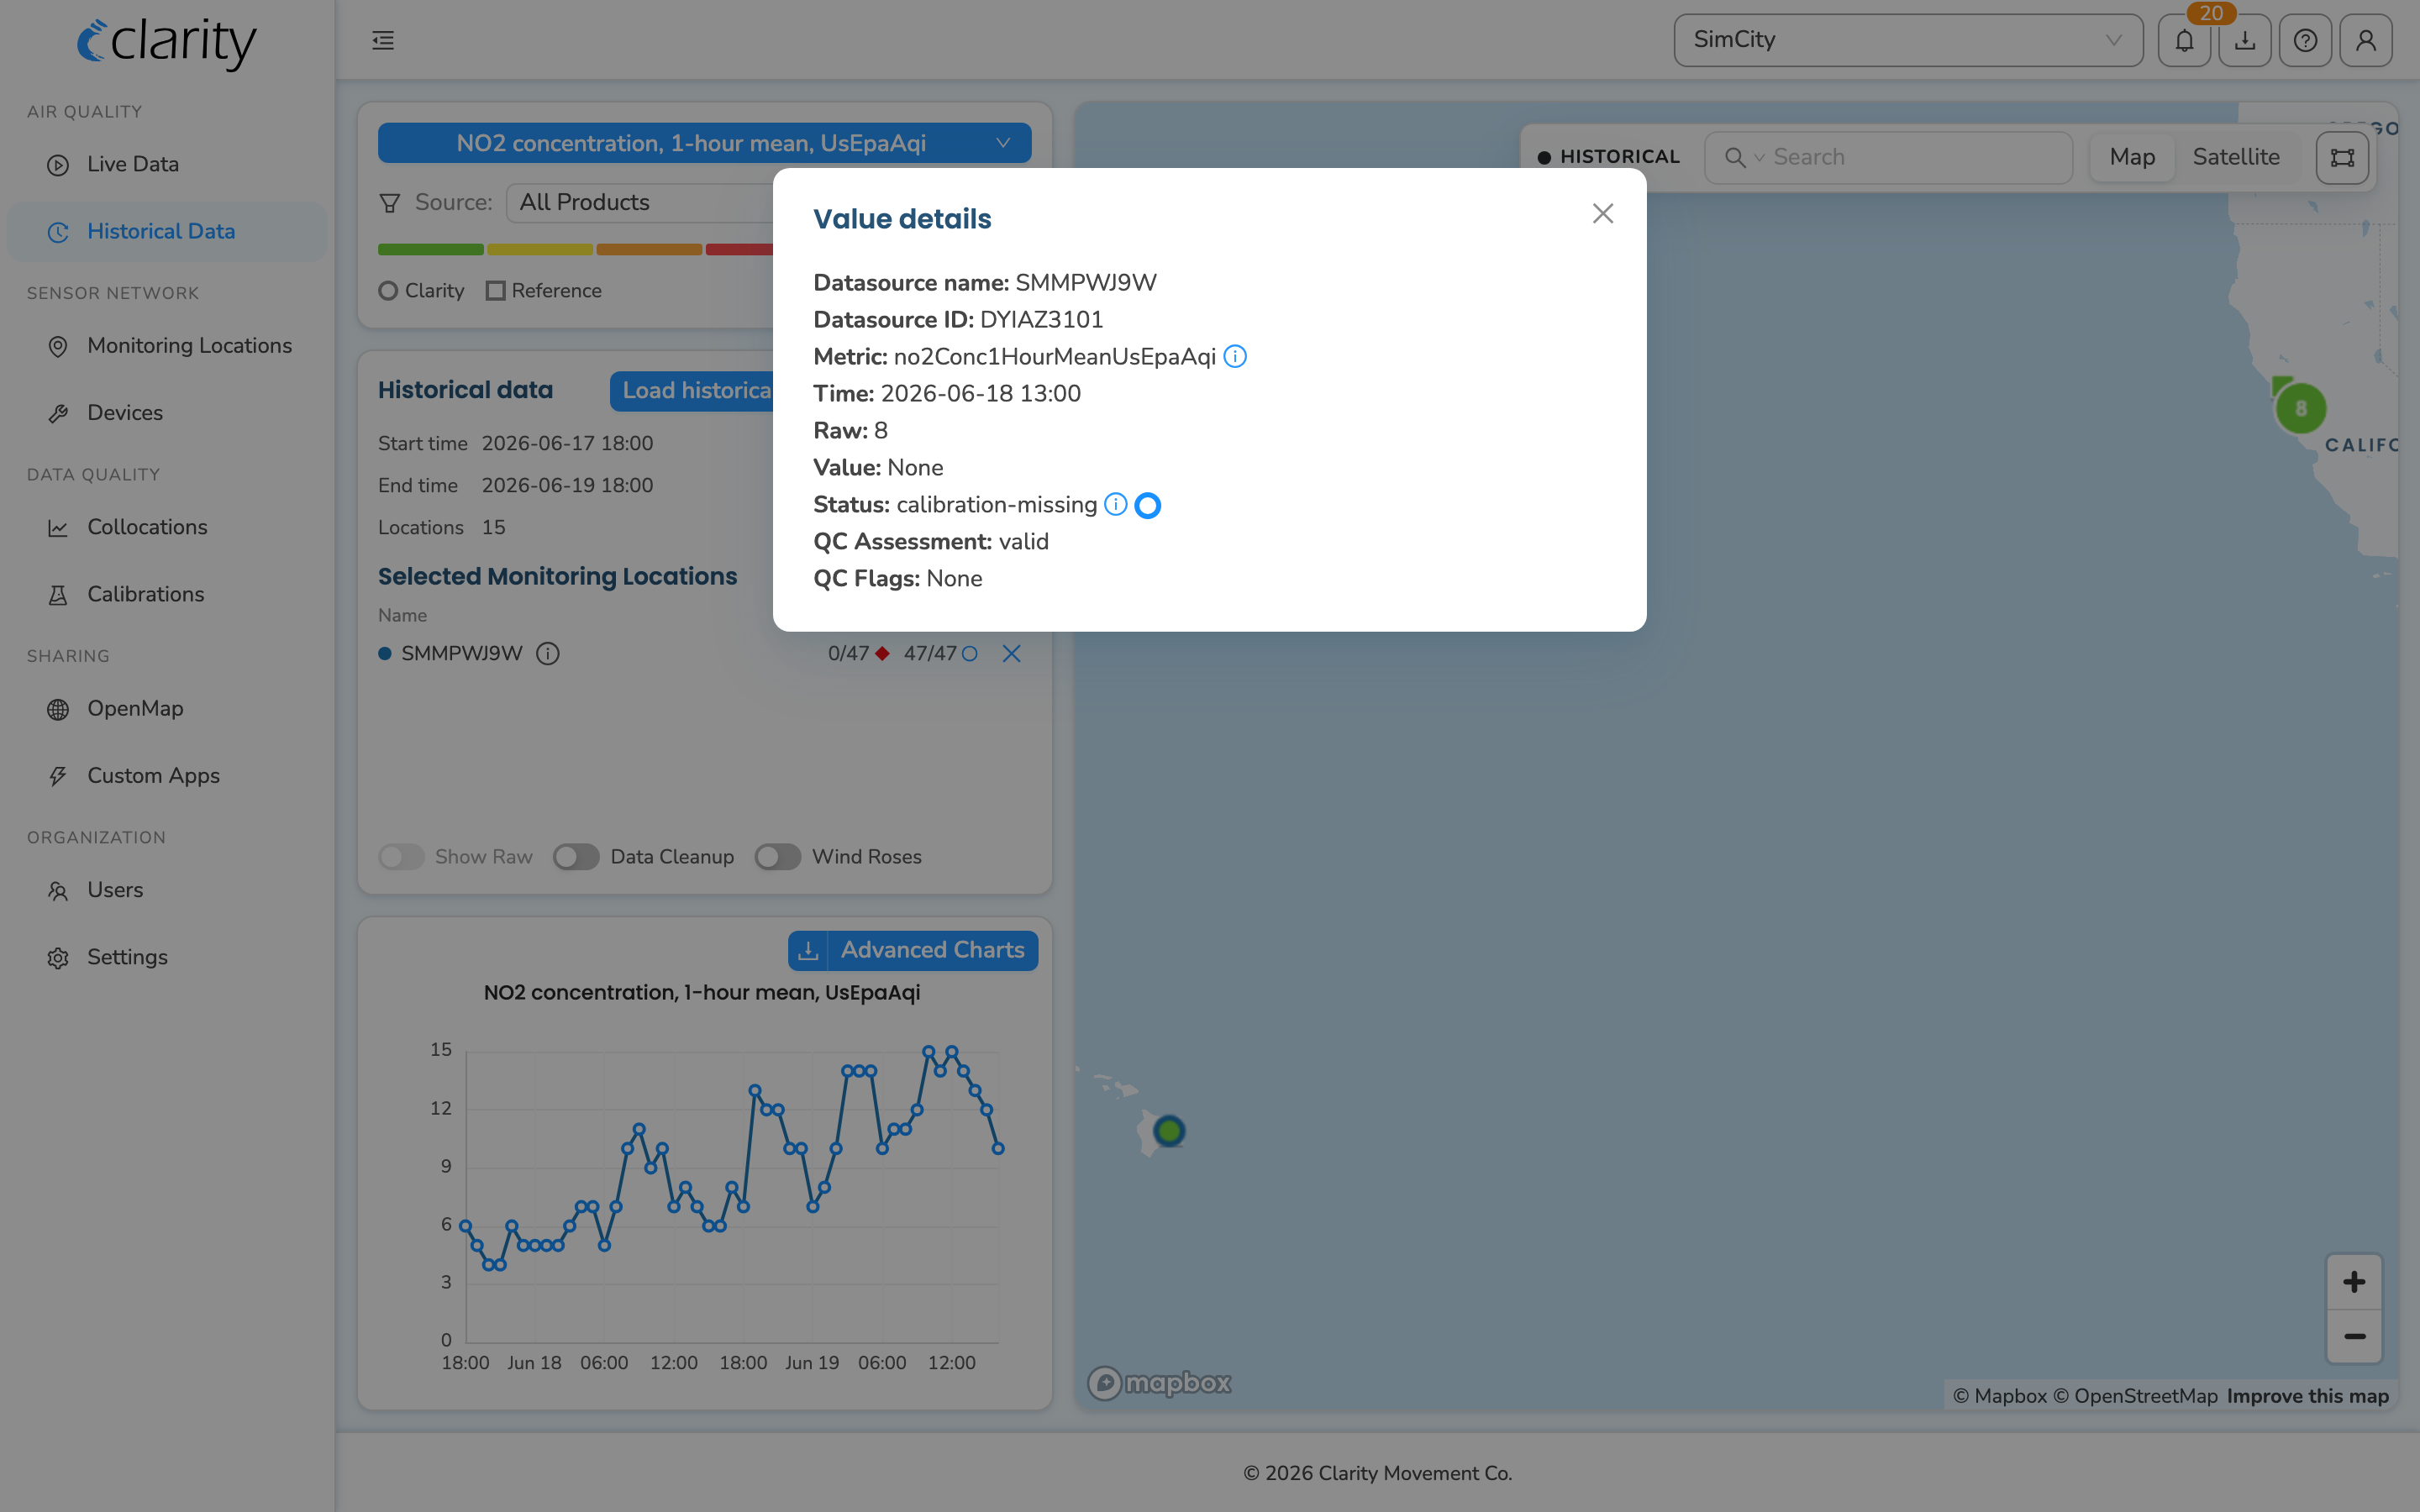
Uncalibrated air quality measurements are shown on the Clarity Dashboard as an empty blue circle. We generally do not recommend using uncalibrated data for public data sharing or analysis (except in certain research-oriented applications where raw data are valuable). To see your device's data without the missing-calibration points, use the Data Cleanup toggle on the Historical Data page.
Where to look
In the left sidebar, open Air quality → Historical Data (route /historical-data).
On Historical Data:
- Click your NO₂ monitoring location(s) on the map, or use all in the Selected Monitoring Locations list to load everything, then press Load historical data.
- In the Metric card on the left, set the parameter to NO₂ | 1-Hour Mean | Concentration.
- Keep the Time Series view active (it's the chart shown in the compact chart slot, and the first tab when you expand the advanced charts).
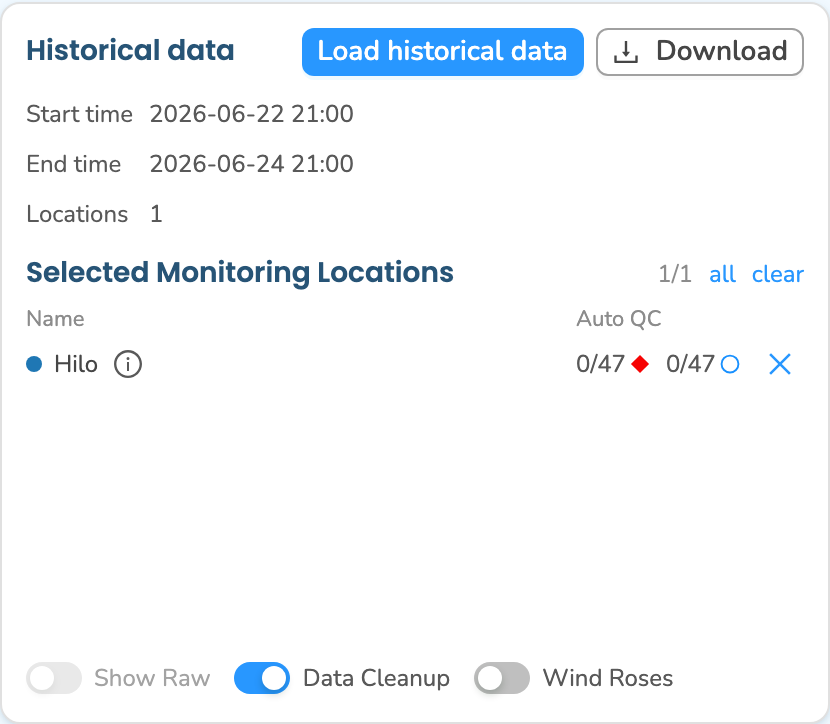
Each row in the Selected Monitoring Locations list (inside the Historical data card) shows two small quality counts per location:
- A red rhombus count under Auto QC — these are QC-invalid measurements (tooltip: QC-invalid measurements).
- A blue empty-circle count — these are the calibration-missing measurements (tooltip: Calibration-missing measurements). The count reads as
missing / total, e.g.116/941.
On the chart itself, every point that is missing a calibration is drawn as a small empty blue circle. Hovering it shows a Missing calibration tooltip, and clicking it opens a Value details modal with the point's raw value, status, time, and QC details. (If a point is both QC-invalid and missing calibration, it's drawn as a red diamond and the tooltip reads QC invalid and missing calibration.)
Hiding the missing-calibration points
The Data Cleanup toggle lives in the footer of the Historical data card (the same card that holds the Selected Monitoring Locations list), alongside the Show Raw and Wind Roses switches. Turn Data Cleanup on to strip QC-invalid values and values missing calibration from what's plotted and downloaded (tooltip: Data Cleanup removes QC-invalid values and values missing calibration).
Note: Data Cleanup is only available when Show Raw is off. With Show Raw on you're explicitly viewing raw, non-calibrated measurements, so cleanup doesn't apply and the toggle is disabled with the hint Turn off Show Raw to enable cleanup of QC-invalid + calibration-missing values.
About the NO₂ global model
The NO₂ global model was developed from hundreds of Clarity Node-S sensor collocations worldwide, yielding a dataset of over six million hourly measurements. To read more about the global NO₂ model, read our blog Introducing Clarity's Global NO₂ Calibration.
While this model performs well in many scenarios, it may be less accurate in extreme conditions or in locations with pollution sources that are not well represented in the training data. When environmental conditions fall outside a representative range in the training dataset, the model does not produce a calibrated NO₂ measurement, to avoid extrapolating beyond the conditions for which it was developed. Those hours are what show up as missing-calibration points on Historical Data.
For projects requiring higher accuracy or tuned to location-specific environmental conditions, we continue to recommend a local collocation and to work with your Clarity Environmental Project Manager to develop a custom calibration model whenever feasible.
Recommended operating range based on training data
| Variable | Approximate range |
|---|---|
| Temperature | 0 – 40 °C (32 – 104 °F) |
| Relative humidity | 0 – 100% |
| NO₂ (raw measurement) | -25 – 51 ppb |
How to check your device calibrations
To confirm which calibrations are assigned to your Clarity Node-S network, visit Check a device's calibration. You can also review the calibrations applied to your measurements on the Data quality → Calibrations page (route /calibrations).
What's next
- See calibration details by pollutant.
- Check a device's calibration.
- Troubleshoot NO₂ readings out of range.
- Know when to recalibrate or replace your Node-S.
Was this article helpful?
Yes, thanks! / Not really
Still need a hand? Email us at support@clarity.io or create a support ticket, and our team will get back to you.