What is a monitoring location (a.k.a. Datasource)
What a monitoring location is, how it relates to the underlying "datasource", and where to find and manage your locations.
"Monitoring location" and "datasource" are two names for the same thing. A monitoring location is the named place on your network where Clarity collects air quality measurements — it's what you see and manage throughout the Dashboard. Under the hood, that continuous stream of measurements is a datasource (its ID starts with the letter
D). The Dashboard leads with "monitoring location"; "datasource" is the older name for the same entity, and you'll still spot theD…ID in a location's detail panel.
What is a monitoring location?
A monitoring location is the named place on your network where measurements are collected — for example a school, a roadside site, or a park. You'll find your locations under SENSOR NETWORK → Monitoring Locations in the left sidebar, and each row on that page is one monitoring location.
Behind each location is a datasource — the continuous stream of air quality measurements, fed by a source device (a Clarity Node or a reference monitor) that pushes its readings into the stream. The location carries annotations (a name, a group, and tags) so you can identify and organize it, and accessing its data requires a subscription. The underlying datasource has an ID that starts with the letter D, which you'll see in the location's detail panel. In day-to-day use you work with the monitoring location; "datasource" is just the technical name for the data stream beneath it.
Why the location is decoupled from the device
A monitoring location adds flexibility because the location and its data stream are kept separate from the physical device:
-
Device replacement — Keep one continuous data stream for a site even when the hardware is swapped out for wear or malfunction. Long-term monitoring data stays unified regardless of device changes.
-
Device relocation — When you move a device to a new site, you can either keep feeding the existing location or start a new one — so data from different sites stays separate and organized.
Finding your monitoring locations
Open Monitoring Locations from the sidebar (under SENSOR NETWORK). The page has two halves:
- Left column — a control card titled Monitoring locations with your fleet filters, plus a details panel that fills in when you select a location.
- Right pane — your locations as a Table or a Map, with a search box. Switch views using the Table / Map toggle in the top-right of that pane. (Table is the default.)
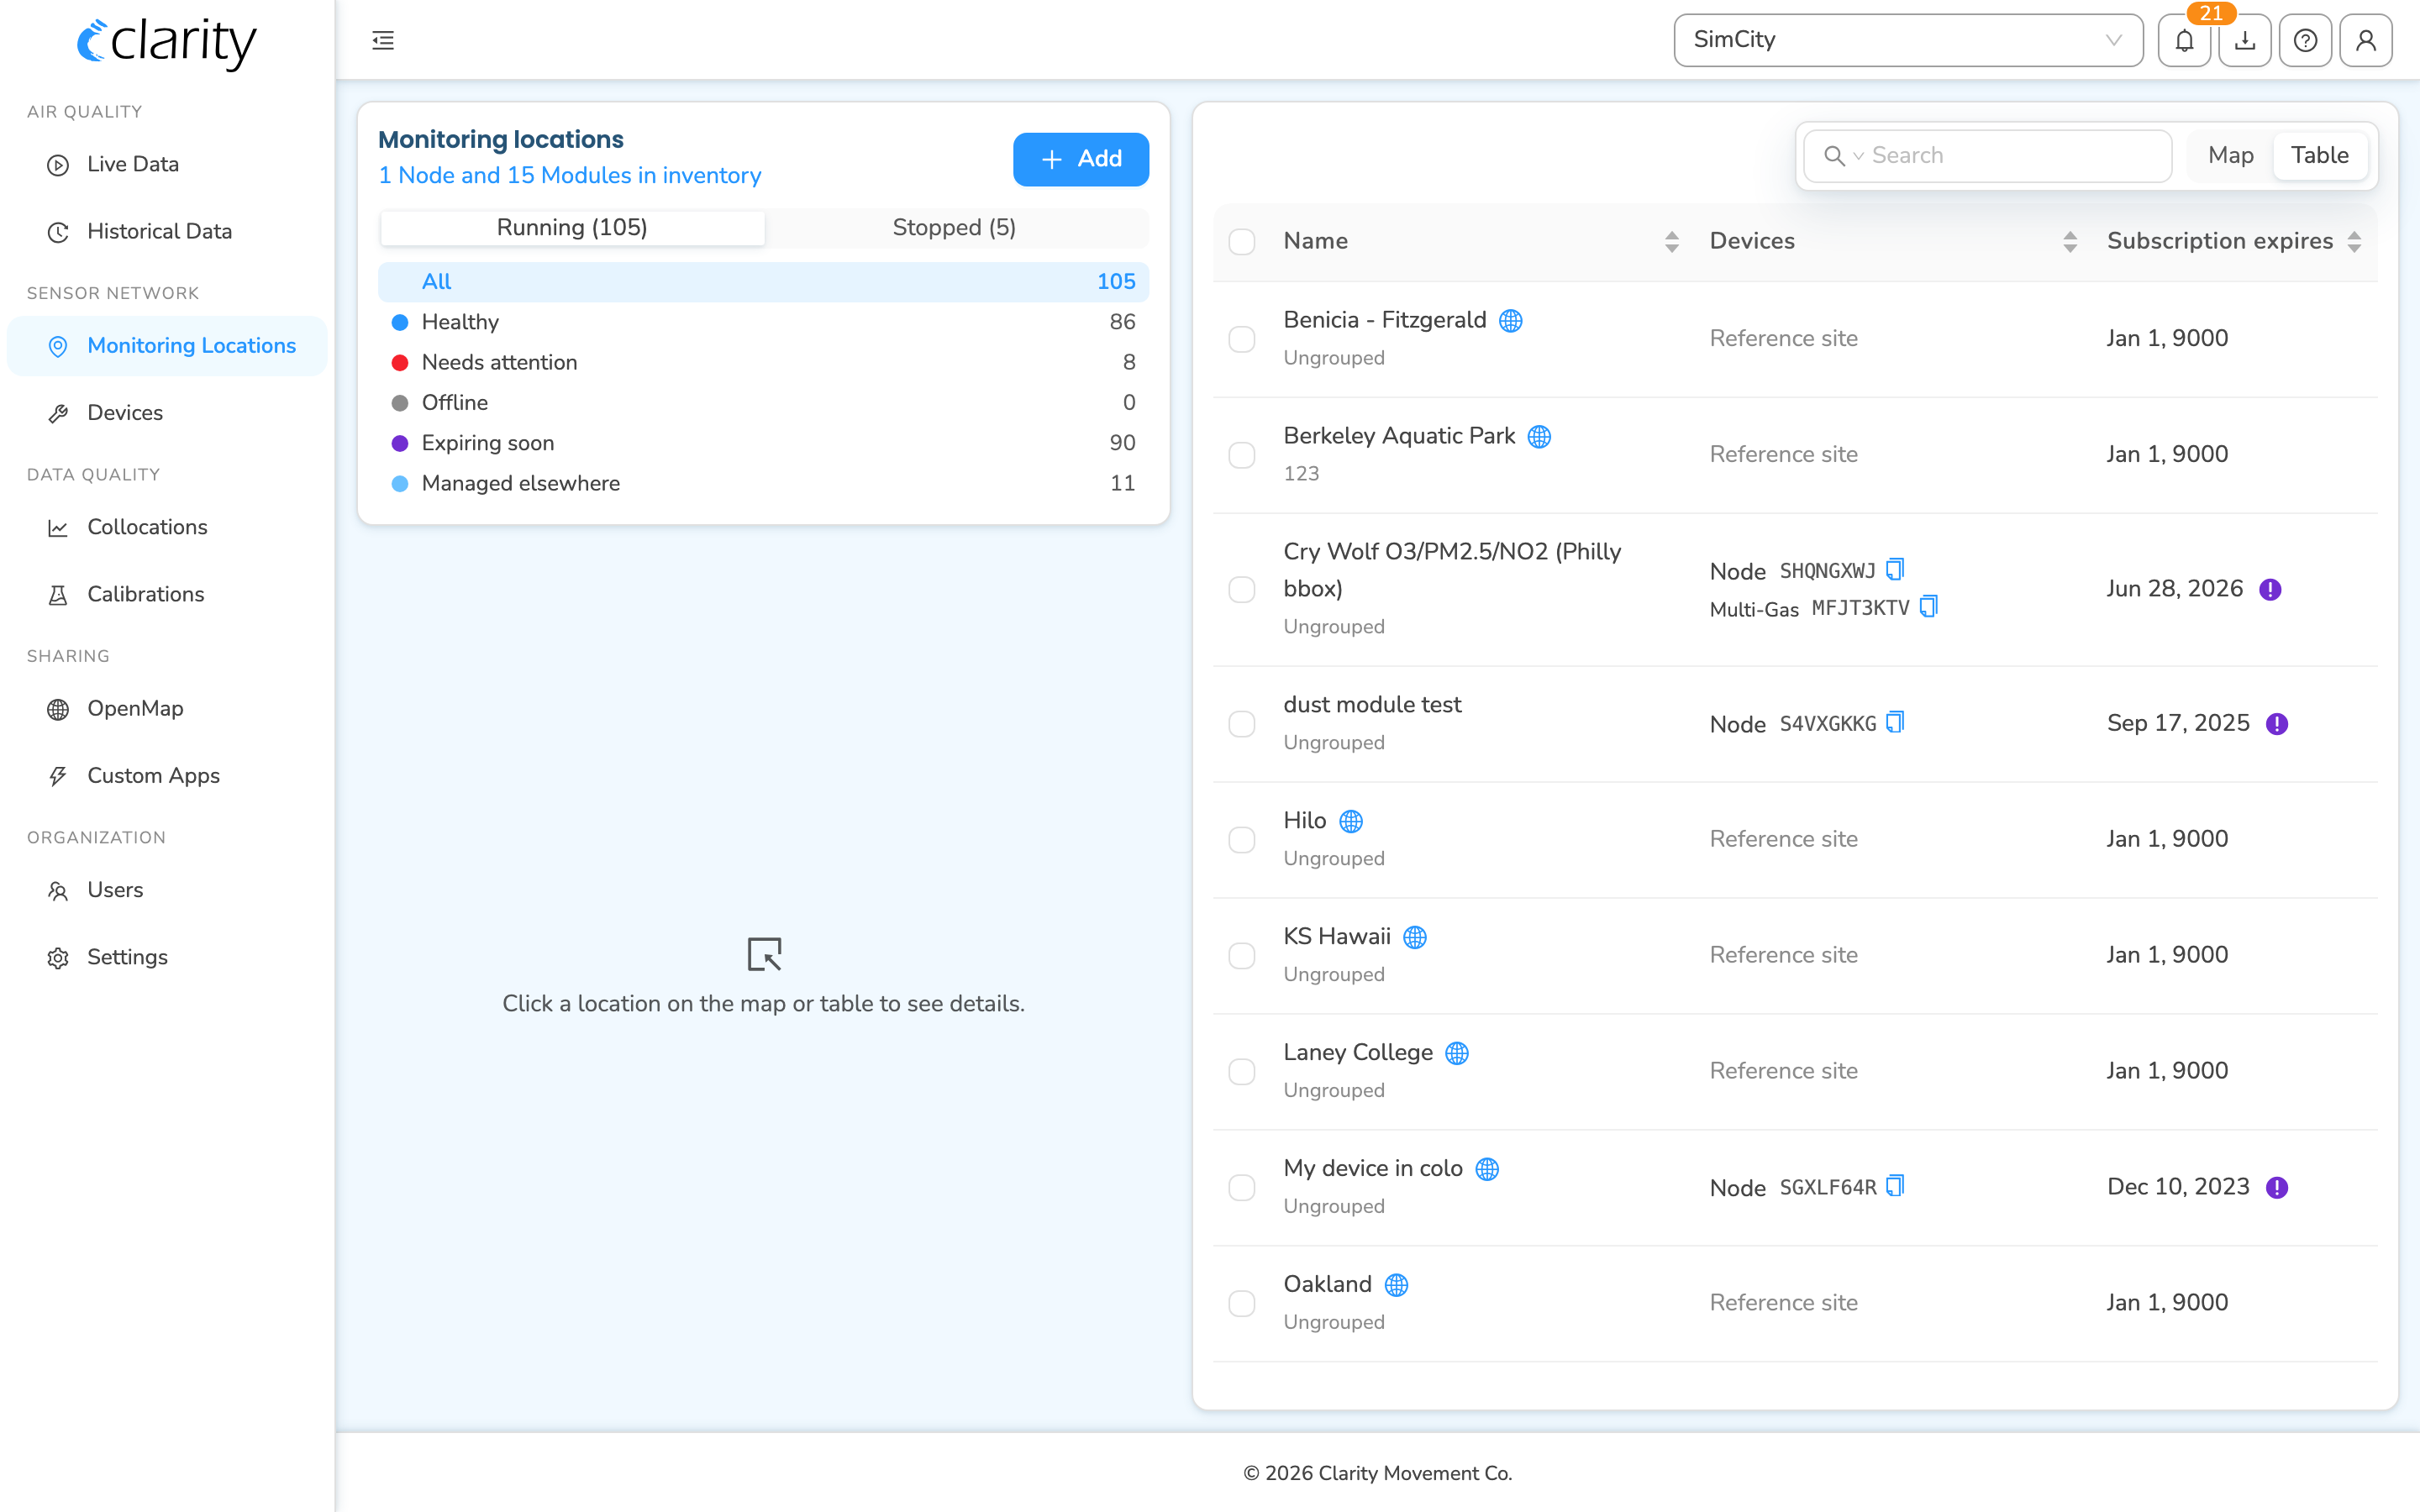
Running vs. stopped
The control card has a Running / Stopped toggle near the top:
- Running — locations with a device currently streaming measurements (the default view). Below the toggle you can refine by status:
- All
- Healthy
- Needs attention
- Offline
- Expiring soon (the subscription is close to lapsing)
- Managed elsewhere (a shared or reference location your org reads but doesn't manage)
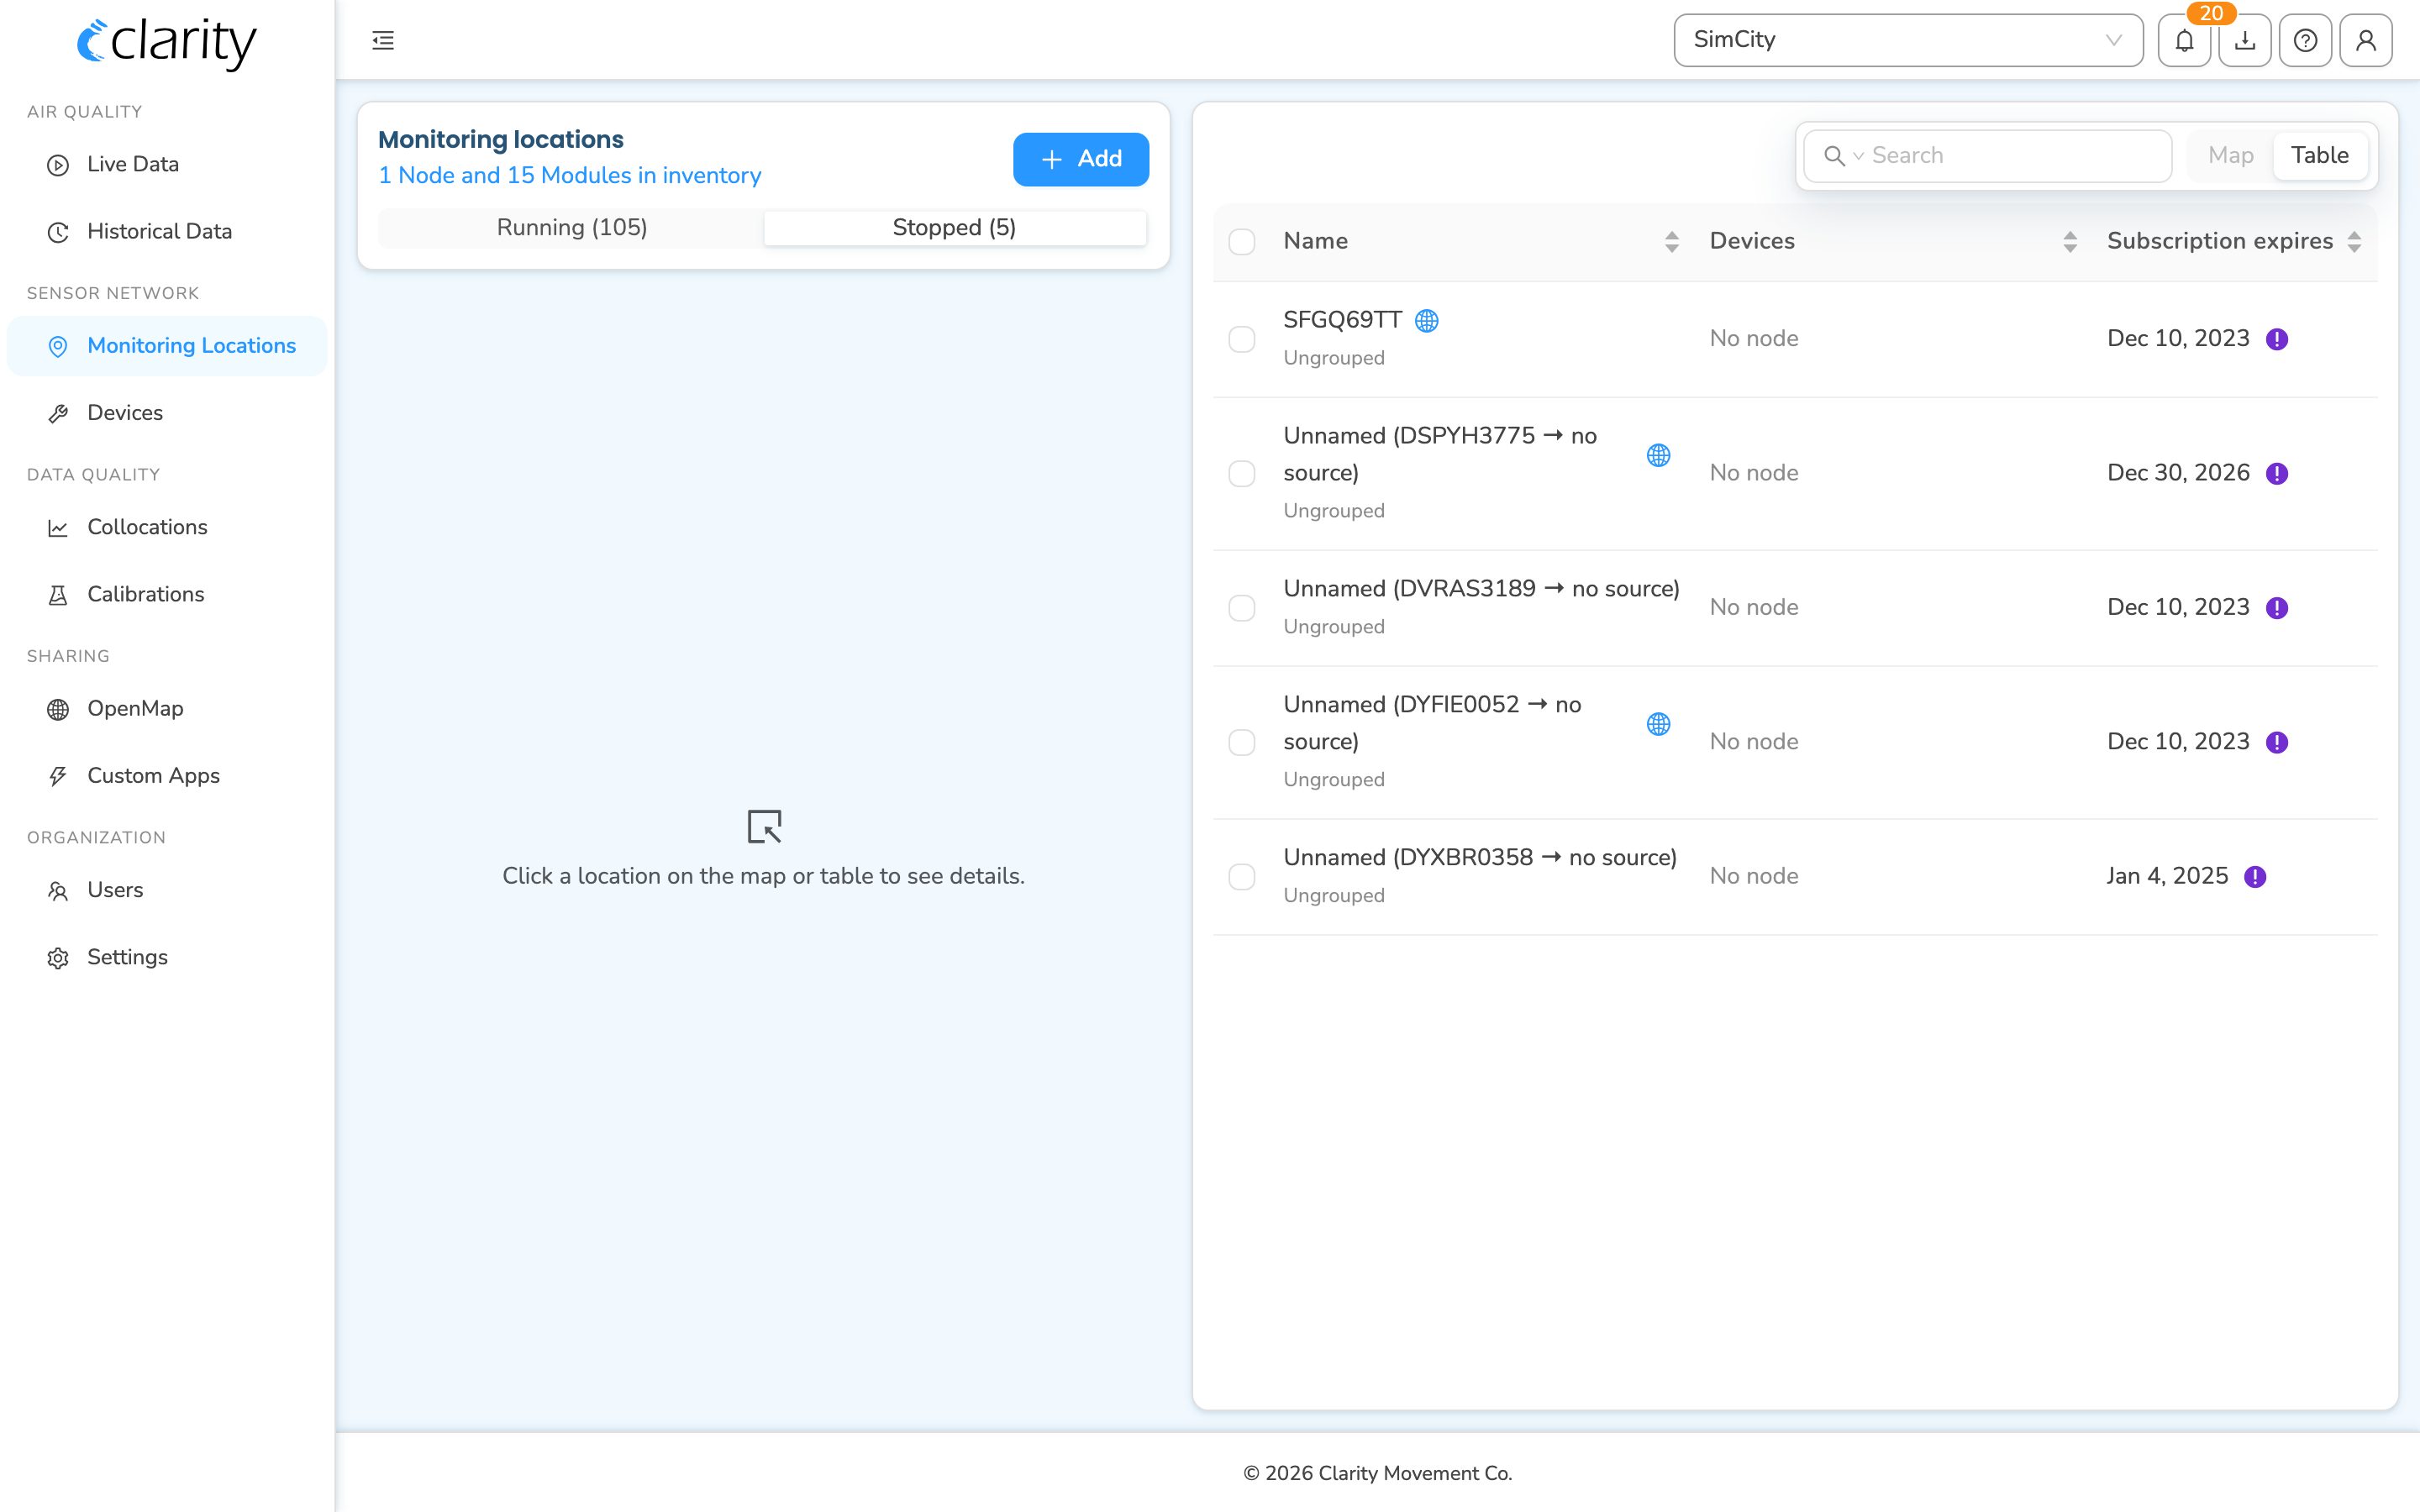
- Stopped — archived locations with no device attached. A stopped location keeps its historical measurements and can be resumed at any time.
The Map view is disabled while the Stopped filter is active — stopped locations have no live position to plot, so the page falls back to the Table.
The inventory hint
If you have unpaired nodes or modules waiting to be deployed, a small line appears under the page title — for example "1 Node and 15 Modules in inventory." Click it to jump straight to the Devices page with the Inventory devices tab pre-selected.
Inspecting a single location
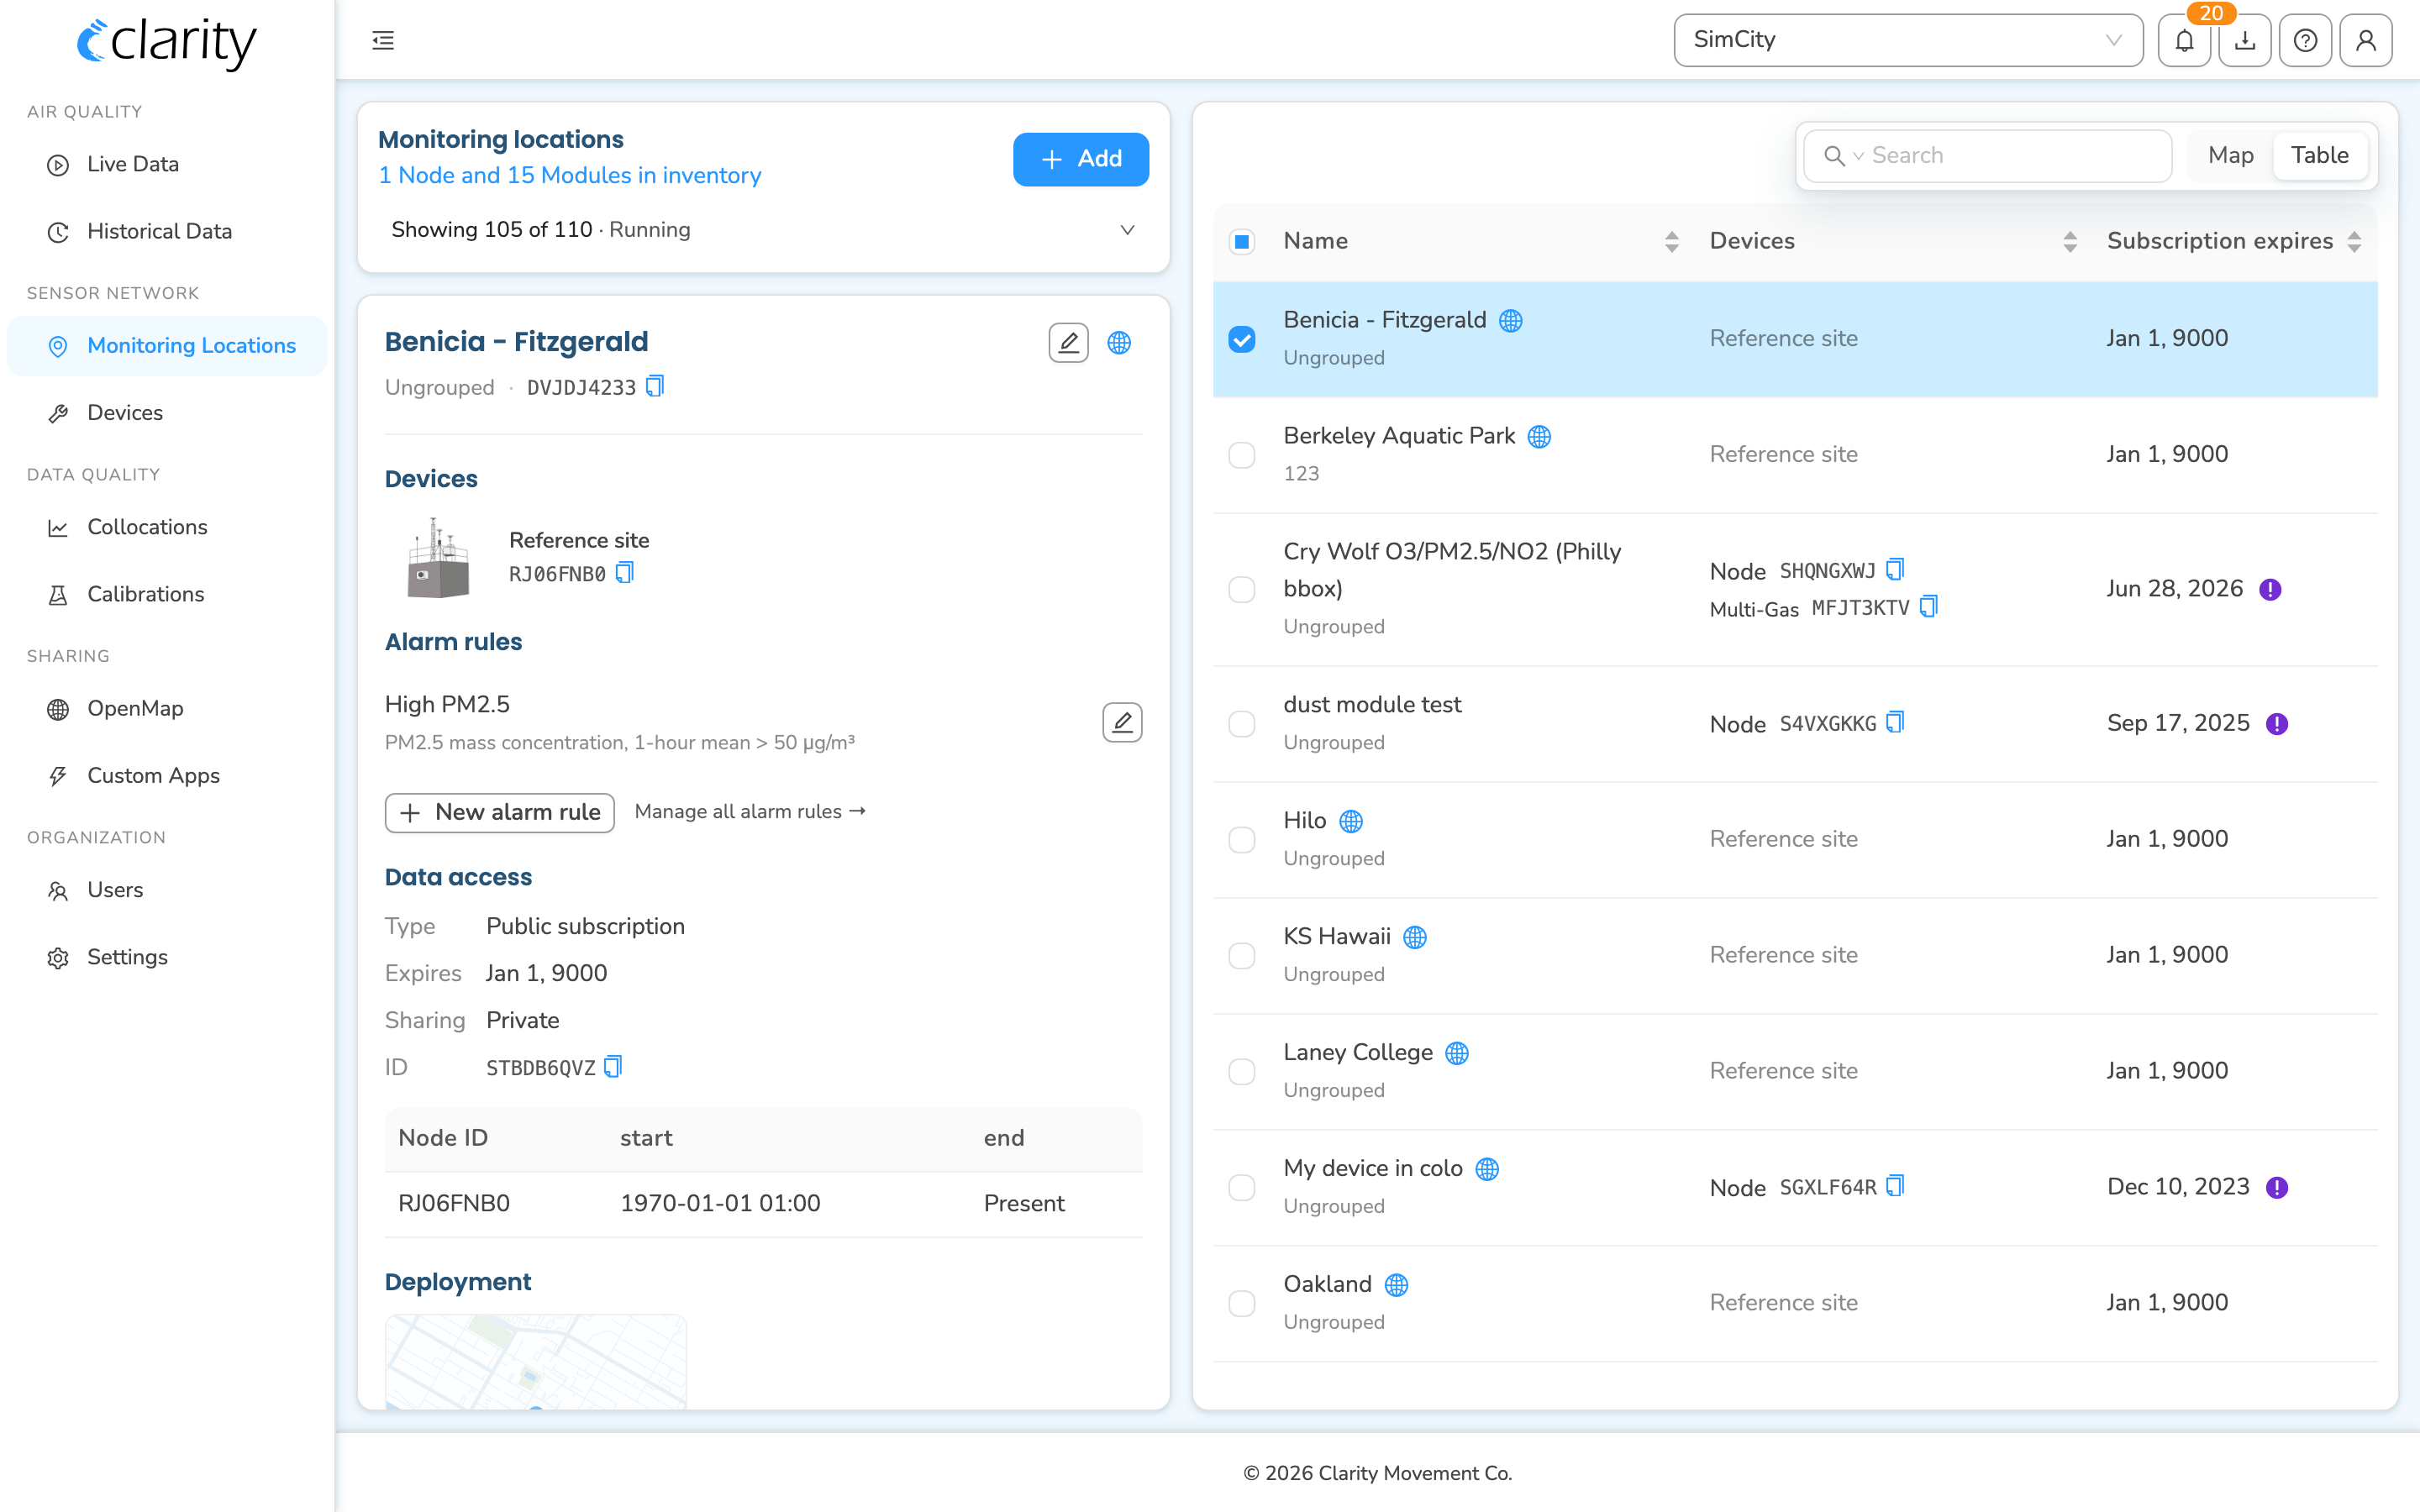
Click any row in the table (or a marker on the map) to open that location's detail panel in the left column. This panel is your one-stop view for everything about the location — the actions are inline controls within the panel.
The detail panel shows:
- Identity header — the location name, its group, the datasource
D…ID (click to copy), any tags, and an OpenMap "open" badge if the data is public. The pencil next to the name opens the Edit name, group and tags modal. - Devices — the attached node and any paired modules, with health, last reading, battery, signal, and power source. Inline controls here let you Replace the node, Pair / unpair modules, and edit the Power source (pencil on the Power row).
- Diagnostics — a button that opens the per-node diagnostics drawer (activity, operational status, alarms). On a node that hasn't reported since configuration, this is replaced by a deployment-status check.
- Alarm rules — the measurement alarm rules covering this location, with quick edit/create.
- OpenMap sharing — whether this location's air quality is shown publicly on OpenMap (Public / Private), editable here if your org manages the location.
- Data access — the subscription type, expiry date (with an "Expired" / "Expiring soon" tag), sharing status, subscription ID, and the per-node deployment history.
- Deployment — site context: a mini-map, indoor/outdoor, height, distance to road, deployment photo, and a Tune placement affordance to nudge the coordinates.
- Bottom actions — Download data, and for a running location, Stop monitoring location. Cross-page links open this location in Live Data or Historical Data.
The Data access and identity sections cover whether your subscription is Licensed (you own it) or Shared (another org shares the data with you), who it's shared with, the source of measurements, and the Open data / OpenMap status.
Editing a location's name, group, and tags
In the detail panel, click the pencil next to the location name. The Edit name, group and tags modal lets you rename the location, assign or create a group, and add tags. Keep these up to date — they're what you search on across your whole organization.
Tip: avoid naming a location after the Clarity Node's ID — if you ever replace the node, the name will no longer match the hardware and cause confusion.
Viewing a location's measurements
To see a location's measurements, use the Historical Data page (AIR QUALITY → Historical Data). You can go there directly, or use the Historical Data cross-page link in a location's detail panel.
On Historical Data, click a location's marker on the map (or use Load historical data to pick a time range), then choose the parameter from the dropdown at the top-left. The page draws the measurement time series and statistics for your selected locations and parameter. You can open the Advanced charts row for scatter, deviation, temporal heat-map, wind-rose, and other views.
Historical Data is a multi-location explorer (map + time series + advanced charts) — you select one or more locations to chart.
Downloading a location's data
Use Download data in a location's detail panel (or select several locations and use the batch Download data button) to queue a data export. You can also start an export from the Download button on Historical Data. Finished exports are managed on the Downloads page in the sidebar.
Working with several locations at once
Select multiple rows (using the checkboxes) or multi-click / lasso on the map. The left panel switches to a batch view listing your selection, with bulk actions:
- Download data for all selected locations
- Set group
- Edit tags
- Manage OpenMap sharing
- a cross-page link to open the whole selection in Historical Data
Managing the lifecycle: deploy, stop, resume, replace, relocate
Most lifecycle actions live right in the Monitoring Locations detail panel (or in the device wizards). Here's where each flow lives.
Starting a new monitoring location (deploy a node)
Two equivalent entry points:
- On Monitoring Locations, click + Add (top of the control card). The Add to your network modal offers:
- Deploy Clarity devices — set up and place a Clarity node from your inventory
- Pair a module — attach an accessory module from inventory to a deployed node
- Add a reference site — subscribe to a nearby regulatory reference monitor
- On Devices, use the Configure node button (top-right) to launch the configuration wizard.
Configuring a node from inventory automatically creates a new datasource — it shows up under the Running filter, streaming in real time.
The + Add picker on Monitoring Locations and the Configure node button on Devices both lead into the
/configure-nodewizard. (Some roles — non-admins without the technician role — see the inventory step directly and skip the +Add choice picker.)
Stopping (archiving) a location
In a running location's detail panel, click Stop monitoring location. The confirmation modal — titled Stop recording data — explains what happens: the node moves to inventory, the location becomes stopped (its historical data is preserved), subscriptions are detached, and any paired modules are unpaired. The location then appears under the Stopped filter.
Resuming a stopped location
Open a stopped location's detail panel. In the Devices section, click Attach node from inventory — this opens the Resume monitoring location modal. Pick any node from inventory (it doesn't have to be the original), preview what will happen, and confirm. The location moves back to Running and the chosen node starts streaming fresh data into the same datasource.
Replacing a node (keep the same datasource)
In a running location's detail panel, in the Devices section, click Replace on the node row. The Replace node modal swaps the hardware while keeping the data flowing into the same datasource — ideal for end-of-life or faulty nodes when you want an unbroken stream.
Pairing or unpairing modules
In the Devices section of a location's detail panel, use Pair module / Pair / unpair modules on the module row. This opens a modal seeded with the selected location's node, so you pick a compatible module from inventory in one step. A standalone Pair a module wizard also exists at /devices/pair-a-module, reachable from the Pair module button on the Devices page header and the Pair a module option in the + Add picker.
Moving monitoring to a new site
- Start a fresh datasource at the new site: Stop the location at the old site (above), physically retrieve and relocate the node — unplug its solar panel or power adapter first so the battery doesn't drain, and charge it overnight if needed — then deploy it at the new site (via + Add → Deploy Clarity devices or Configure node). The original datasource lands in Stopped; a new one starts Running, keeping the two sites' data cleanly separated.
- Keep the same datasource: If you're only fine-tuning placement at the same site, use Tune placement in the Deployment section to nudge the coordinates without interrupting the stream.
Reference-site datasources
Clarity Cloud manages these automatically. When a reference monitor near your node becomes available, its datasource can be integrated into your organization — you can also add one yourself via + Add → Add a reference site. Reference-site locations appear as Managed elsewhere and are read-only where you don't own the device.
A note on the Devices page
The Devices page (SENSOR NETWORK → Devices) is the unified home for all the hardware you own, split into Deployed devices and Inventory devices tabs, with Configure node and Pair module buttons in the top-right.
On the Deployed devices tab, each row has a ⋮ (row actions) menu containing:
- Diagnostics
- Manage monitoring location (jumps to this location on Monitoring Locations)
- Open in Live Data
- Load historical data
The lifecycle actions live in the Monitoring Locations detail panel (Stop, Replace, Pair/unpair, Change power, Tune placement) and the Configure node / Pair a module wizards.
What's next
- Swap a Node while keeping the same datasource.
- Name, group and tag your monitoring locations.
- Manage your nodes on Dashboard.
- Get an overview of your network on Live Data.
Was this article helpful?
Yes, thanks! / Not really
Still need a hand? Email us at support@clarity.io or create a support ticket, and our team will get back to you.