Using R² and RMSE together to evaluate sensor performance
R² and RMSE are the two statistics you'll lean on to judge your device's performance — but each one has real blind spots on its own. This article shows you how to read them together, along with what you know about the pollutant, to draw sound conclusions.
So you know: If you're new to these metrics, start with what R² and RMSE are.
Why R² isn't enough on its own
R² is the most commonly cited accuracy metric and shows up in sensor "rankings," but it shouldn't be used in isolation, for two reasons.
It depends on the concentration range. R² expresses how well a device tracks changes in concentration, so it doesn't work well when there isn't much change to evaluate. With real field data from a Clarity Node and a collocated reference monitor, the R² is 0.86 for the full dataset — but when you filter to only concentrations below 20 µg/m³, it drops to 0.65. It's the same sensor, so ideally it shouldn't get a different score just because of the range it was tested over.
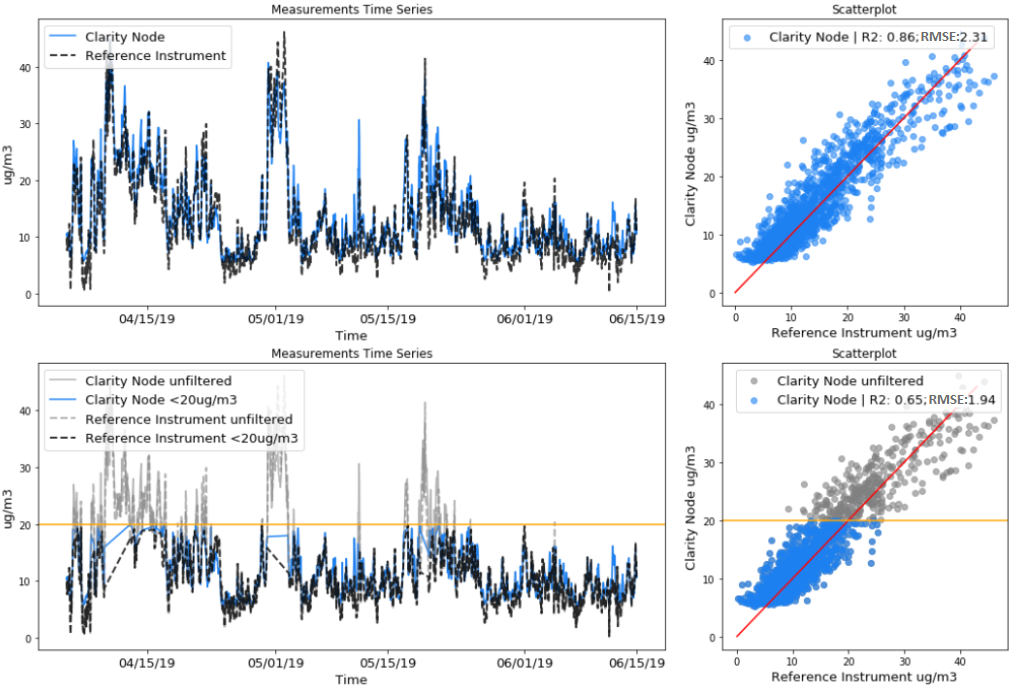
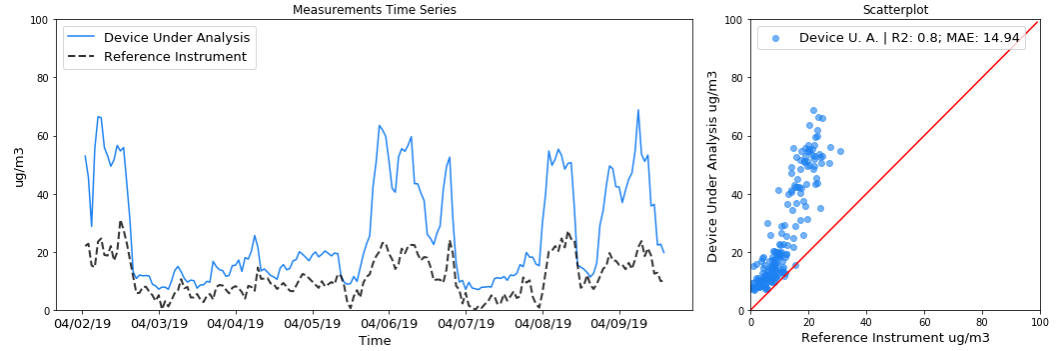
It only measures relative change. R² tells you whether a device tracks relative ups and downs, not whether it outputs the same value as the reference. Relying on R² alone, you might think a sensor is doing well while missing that it's overestimating concentrations.
Why RMSE isn't enough on its own
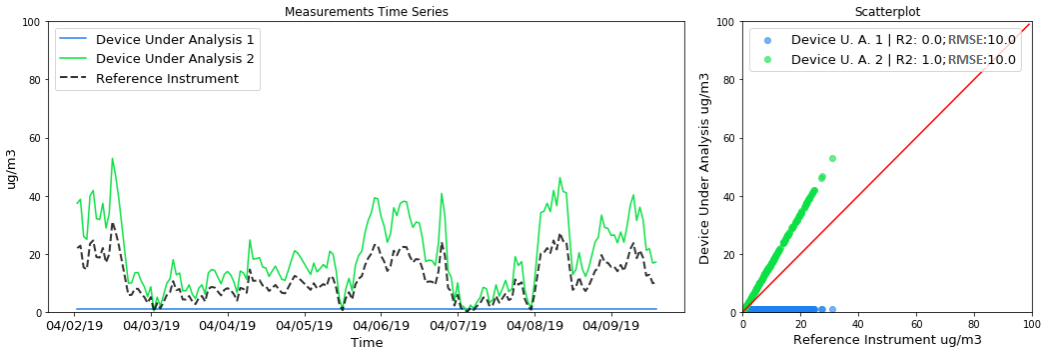
RMSE has limits too. It doesn't tell you whether a deviation can be corrected through calibration or is caused by random error and sensor limitations that can't be corrected — all kinds of deviation raise RMSE equally. A sensor with a high R² that tracks changes perfectly but is off by a consistent factor (perhaps from poor calibration) might have a similar RMSE to a broken device that always outputs the same number. The good news: a high R² points to the possibility of calibrating the device.
Like R², RMSE is also affected by the concentration range it's evaluated over: testing a sensor over a high concentration range can produce a high RMSE but a low relative error.
Reading them together: a worked example
To avoid these pitfalls, use R² and RMSE in tandem. Imagine evaluating two sensors:
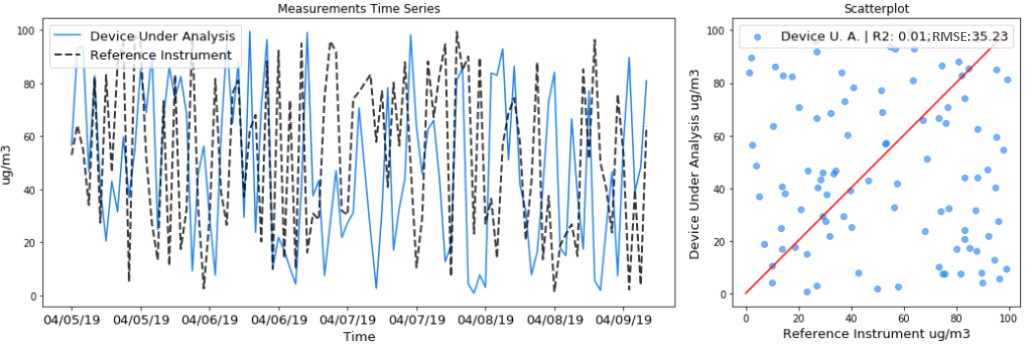
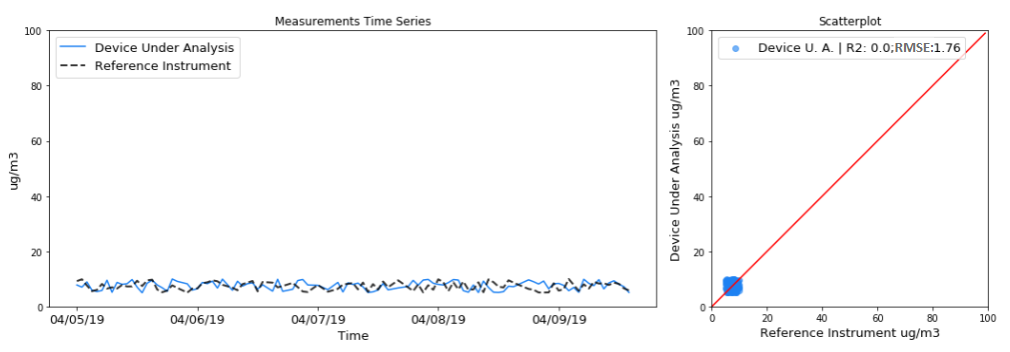
Both graphs show R² close to 0. On the top graph, RMSE is 35.23 µg/m³; on the bottom, RMSE is 1.76 µg/m³. (The y-axis is fixed from 0 to 100 in both to make the difference clear.)
Now add what you know about pollution:
- Top graph — no correlation (R² =
0.0) and a deviation of35.23 µg/m³. A deviation that large could badly misclassify air quality, so this device should be regarded as inaccurate for monitoring ambient air quality. - Bottom graph — also no correlation (R² =
0.0), but a deviation under2 µg/m³. That's not significant compared to the bigger changes you're trying to observe, so in principle this device might classify air quality correctly. The low R² is likely just the result of a narrow concentration range during the test — the time series is nearly flat and never exceeds10 µg/m³. The fix is to repeat the test over a wider concentration range.
Summary
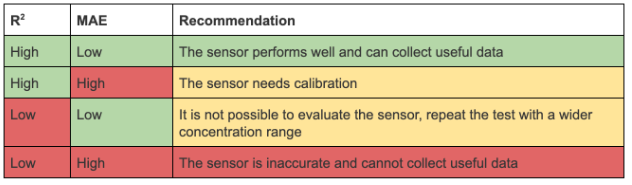
R² and RMSE each tell you something different about a sensor's ability to measure air pollution accurately, and each has blind spots the other helps cover. Use them together, with your knowledge of the pollutant, rather than either in isolation. This summary chart pulls it together:
What's next
- What are R² and RMSE? (the basics)
- Compare your collocated device to a reference monitor
- When to recalibrate or replace your Node-S
Was this article helpful?
Yes, thanks! / Not really
Still need a hand? Email us at support@clarity.io or create a support ticket, and our team will get back to you.