Understanding the Diagnostics view for a device
The Diagnostics view answers one question: what's going on with this node right now, and if something's wrong, what is it? This article walks through how to open it and how to read each section.
Opening Diagnostics
Diagnostics is the same drawer no matter where you launch it. You can reach it from three places, so you don't have to leave whatever you were doing.
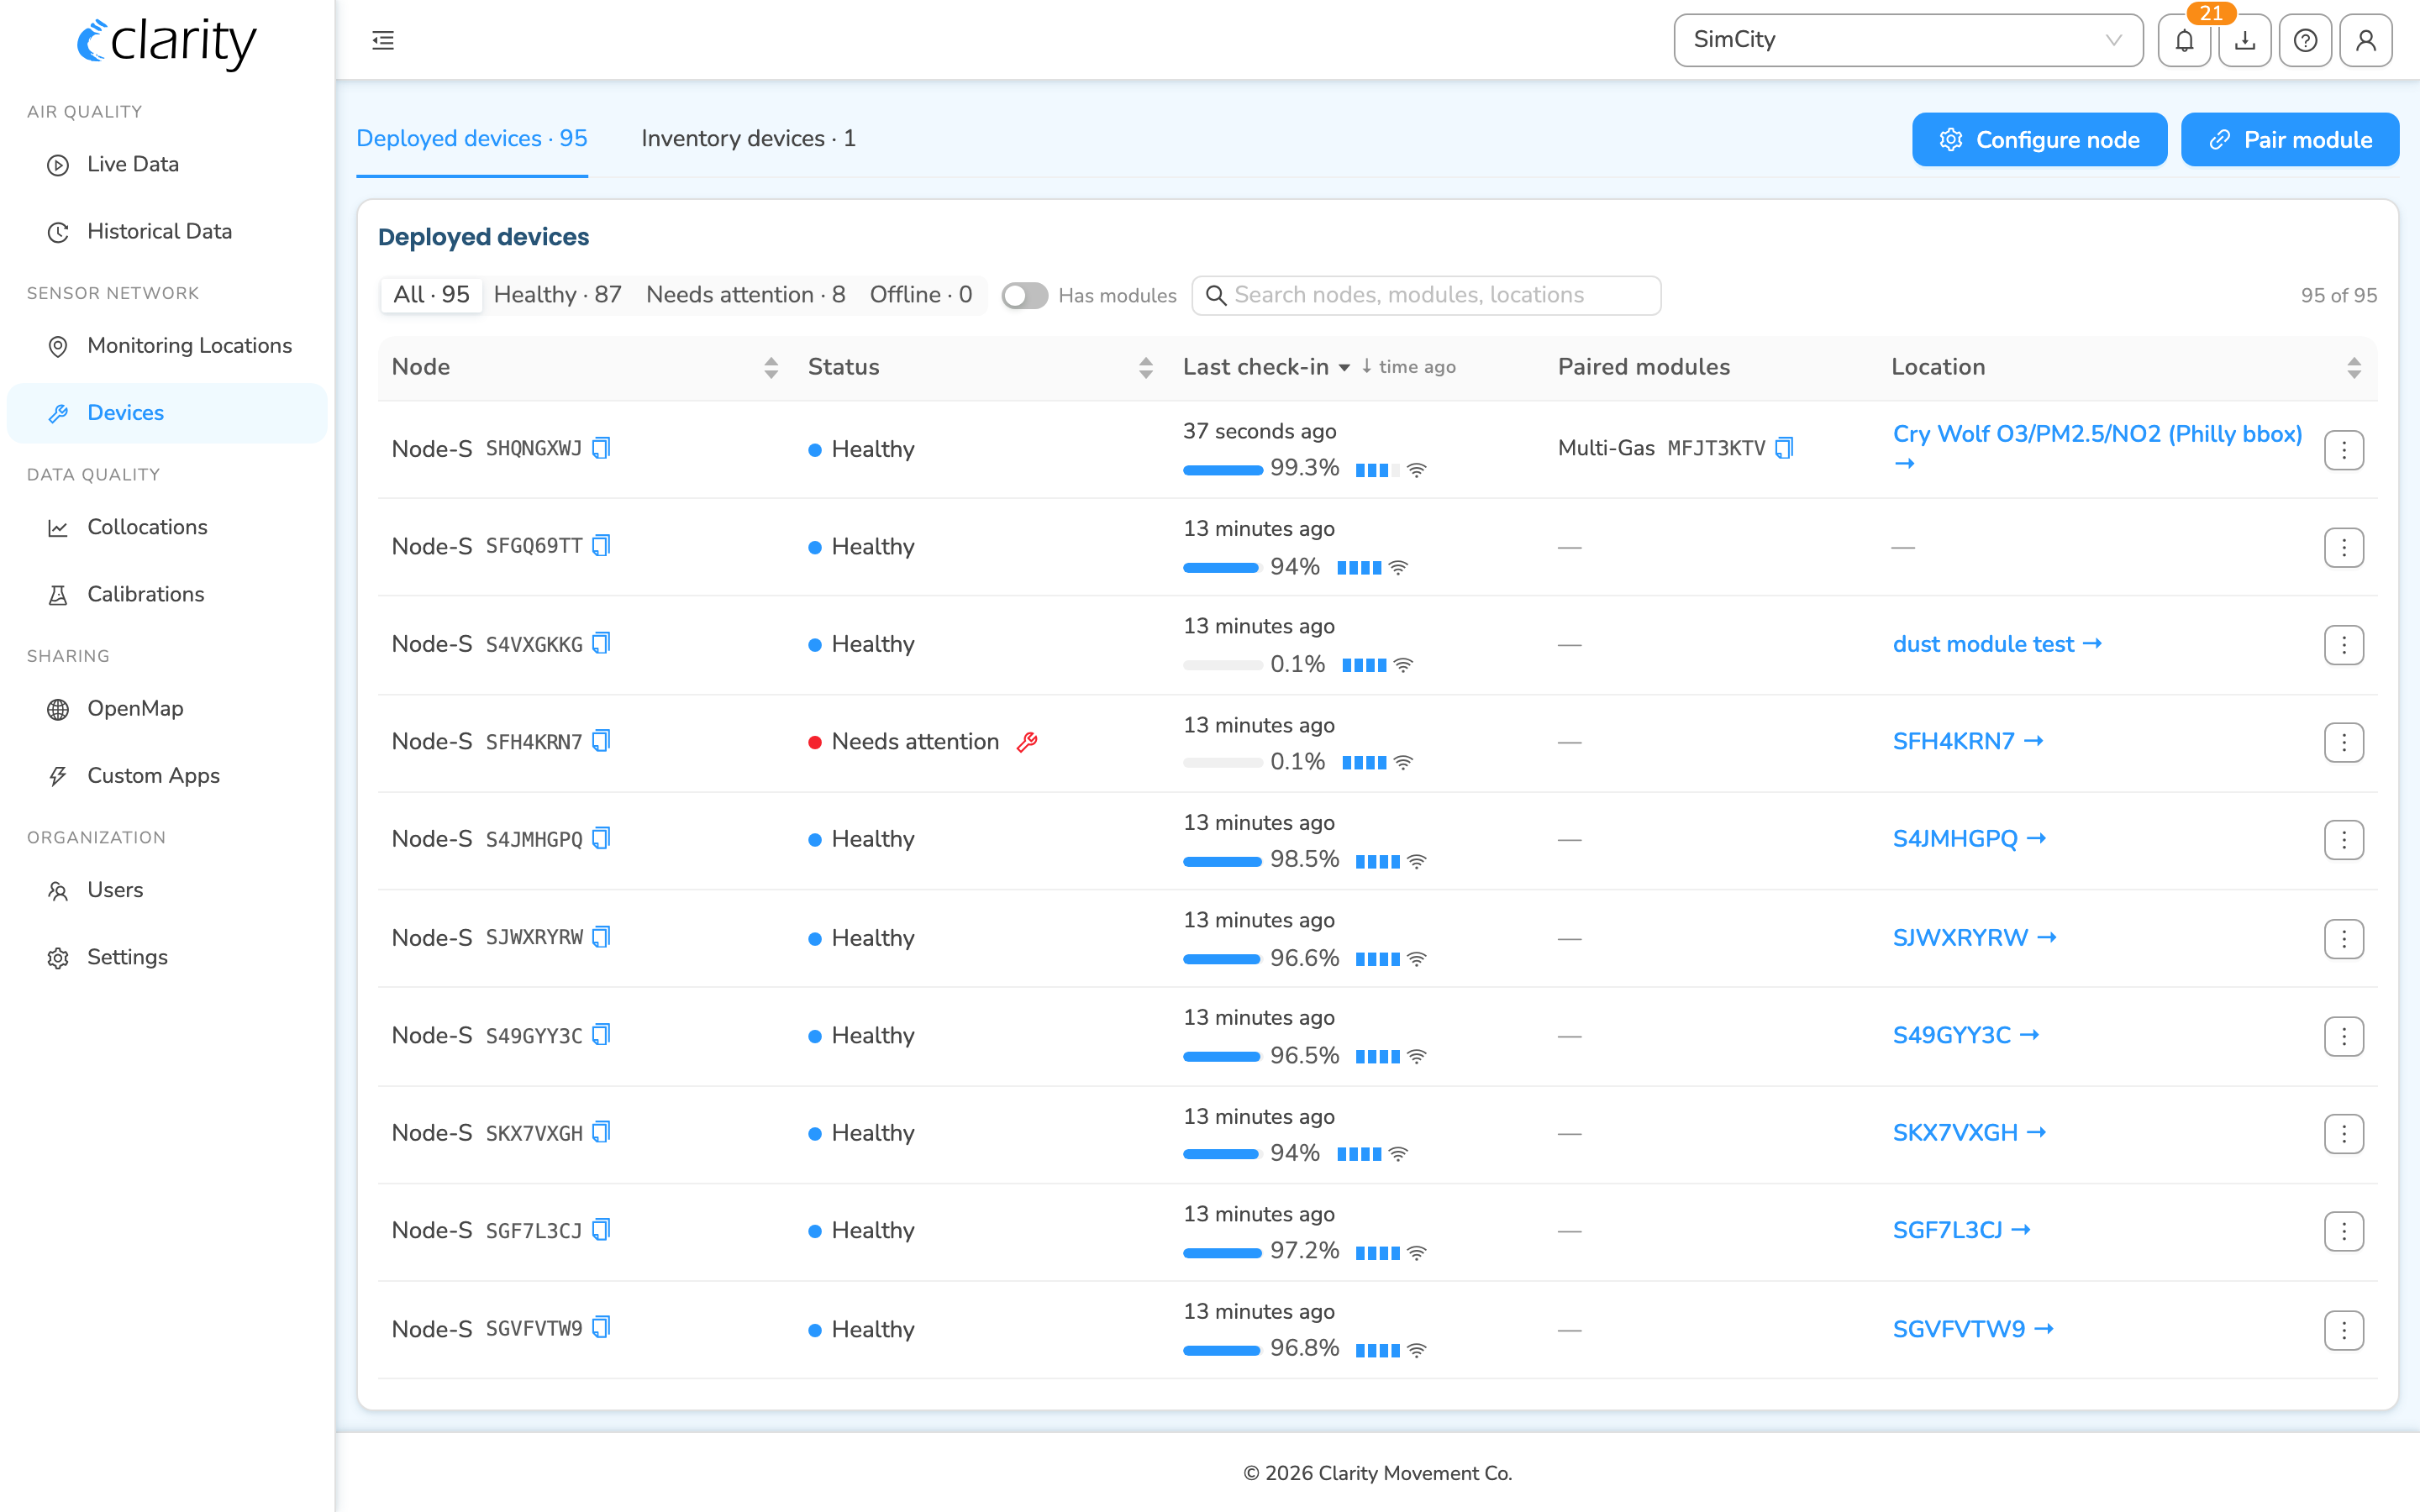
From the Devices page (most common)
- In the left sidebar, under SENSOR NETWORK, click Devices.
- Stay on the Deployed devices tab (it's selected by default).
- Find the node you want — use the search box (search by node ID, module ID, or location name) or the All / Healthy / Needs attention / Offline filter buttons to narrow the list.
- Open Diagnostics one of two ways:
- Click the ⋮ (row actions) menu at the right end of the row and choose Diagnostics — it's the first item in the menu.
- For any row that is Needs attention or Offline, a wrench icon appears right next to the status dot — click it as a one-click shortcut. (Healthy rows don't show the wrench, to keep the list clean.)
showing Diagnostics / Manage monitoring location / Open in Live Data / Load historical data — route
/devices
Note: A node that was just configured and hasn't reported yet shows a Waiting for first reading pill instead of a status dot. For those nodes, the commissioning tracker is more useful than Diagnostics, so the wrench shortcut isn't offered.
From a Monitoring Location
- In the sidebar, under SENSOR NETWORK, click Monitoring Locations.
- Select the location whose node you want to inspect.
- In the location workspace, click the Diagnostics button (it sits with the device section and turns red when the device needs attention).
From Live Data
- In the sidebar, under AIR QUALITY, click Live Data.
- Click a location on the map or in the list to open its detail panel.
- Click Diagnostics in that panel.
workspace — route
/monitoring-locations
Reading the Diagnostics drawer
The drawer opens from the right. Its title reads Diagnostics with a colour-coded status pill, and underneath it lists the node and any paired modules (for example "Node-S A8ZB28CY · Dust M3ABCDEF"). Each ID has a click-to-copy affordance.
The status pill is the node's overall health summary:
- Healthy (blue) — the device is working well.
- Needs Attention (red) — the device has one or more active alarms.
- Offline (grey) — the device has stopped reporting (a late-reading alarm).
- Coming Online — shown briefly for a freshly-configured node.
The body of the drawer has three stacked sections: Activity, Operational Status, and Alarms.
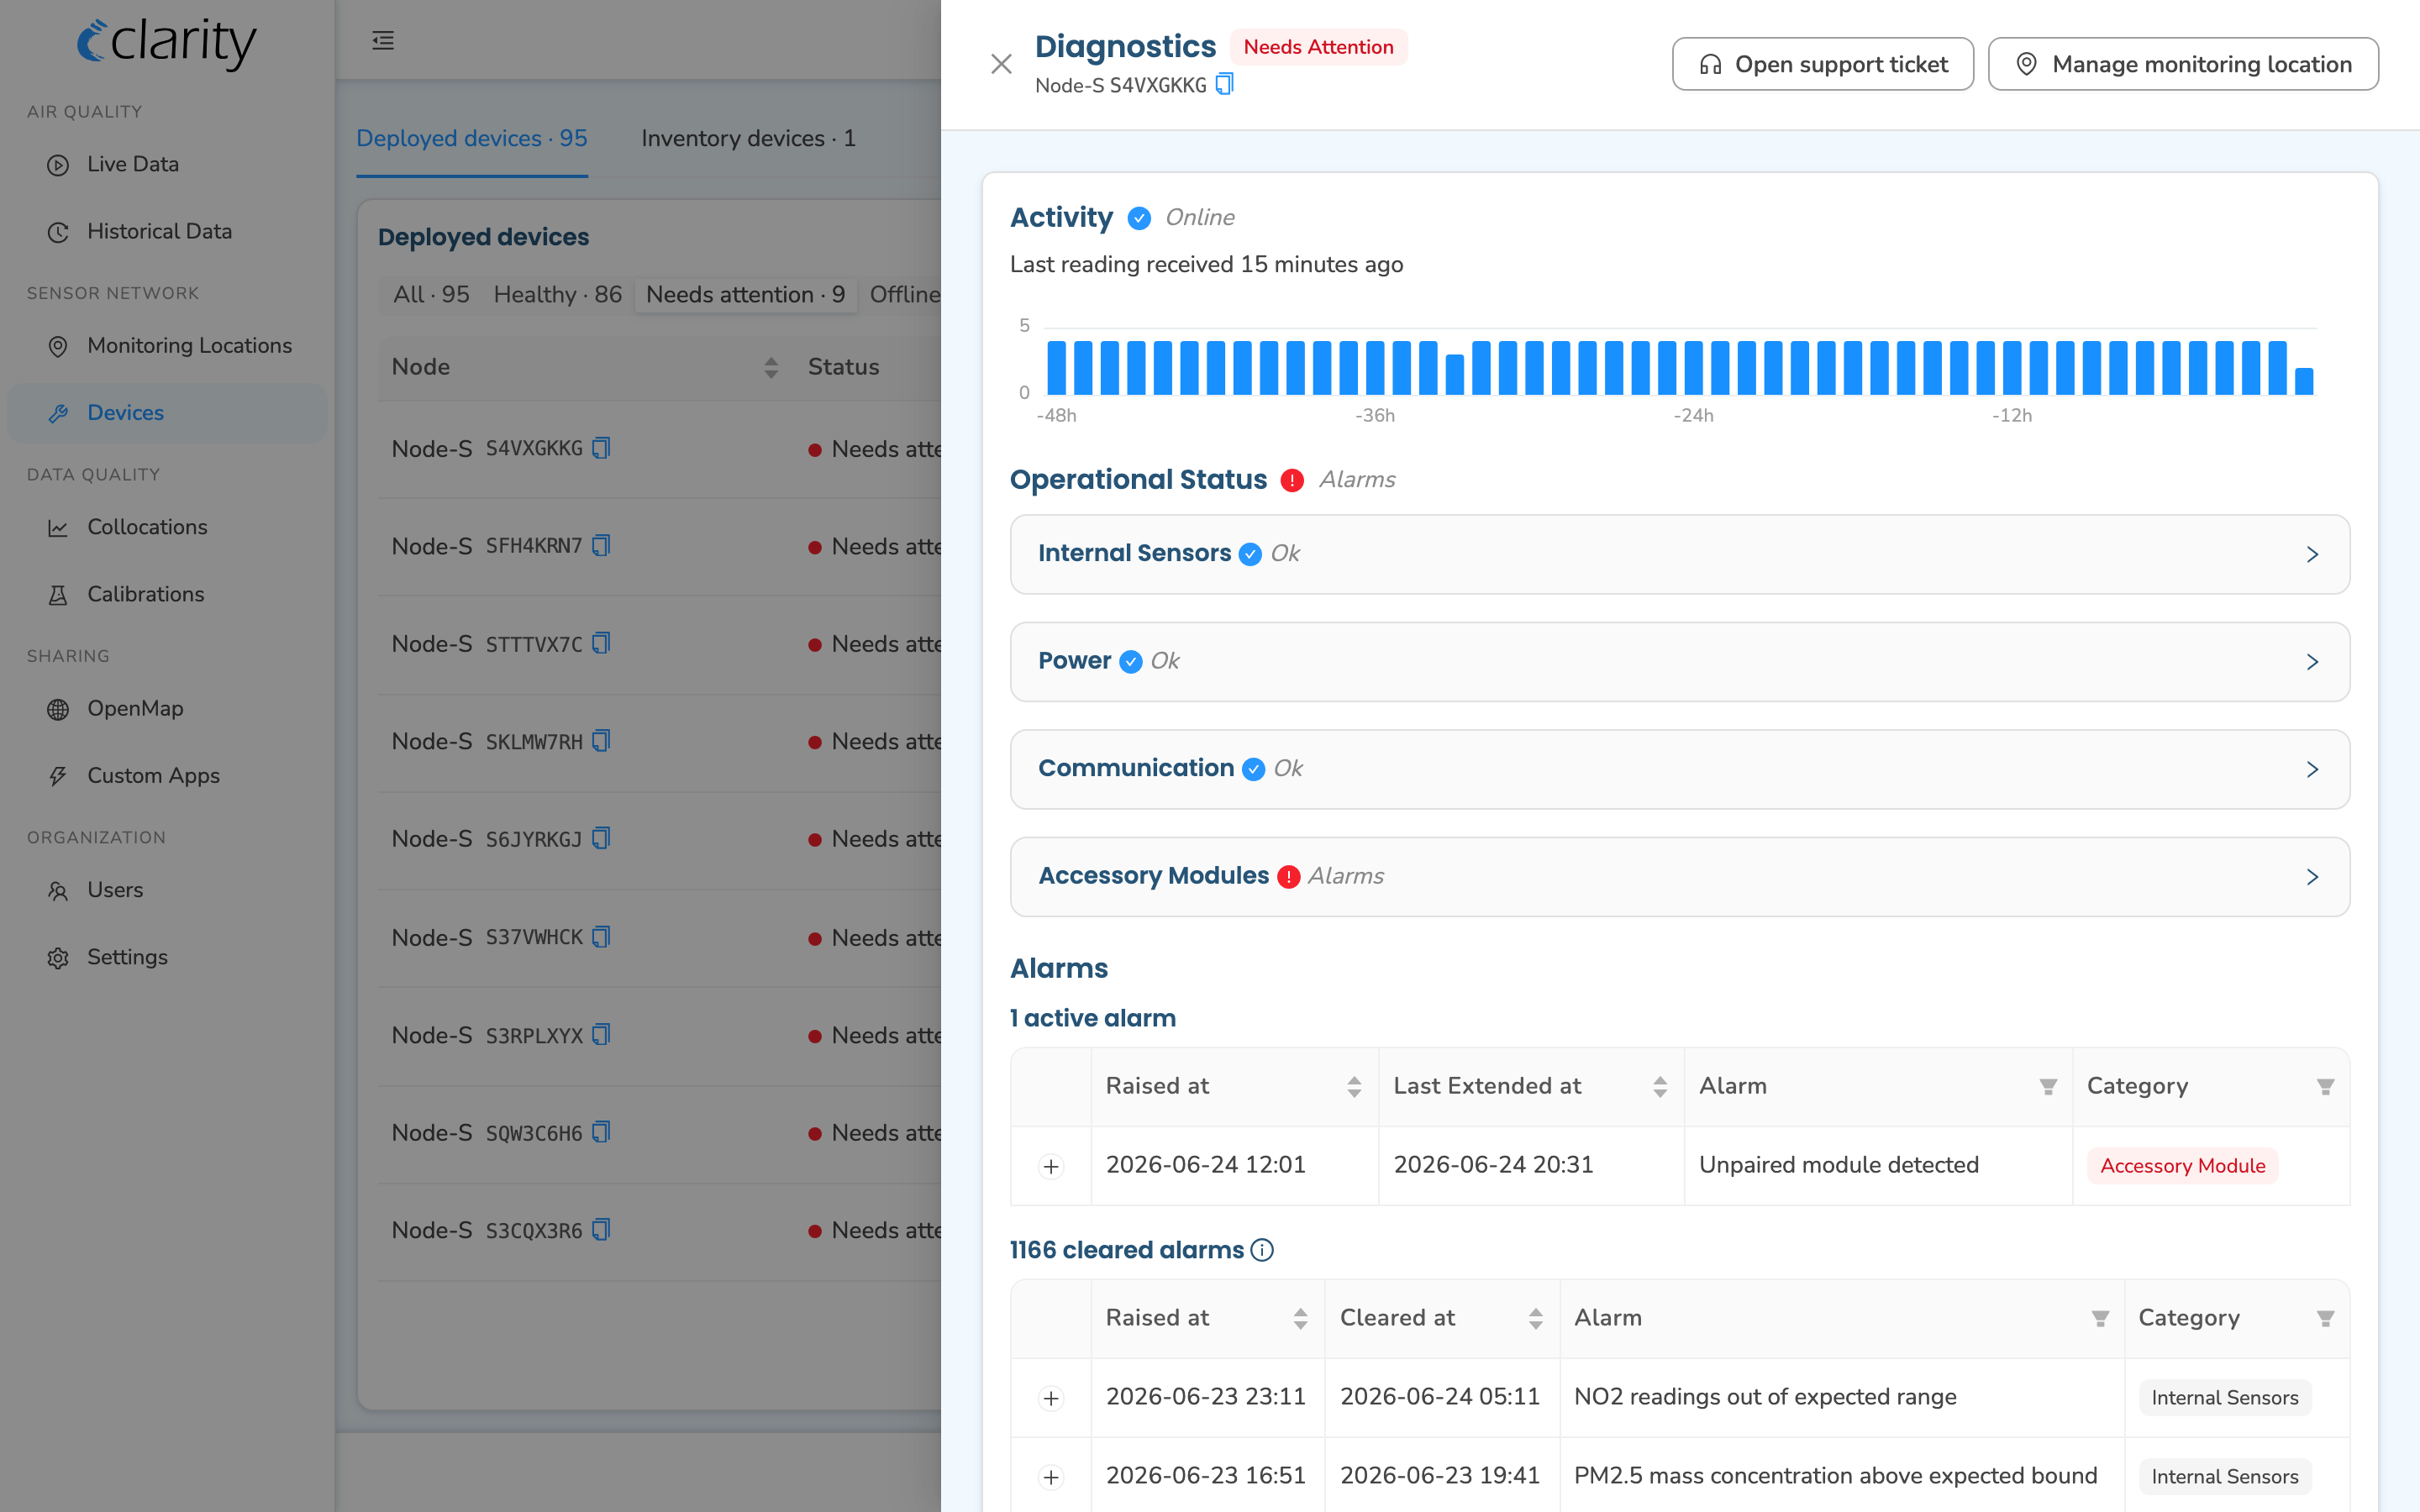
Two next-step buttons in the header
At the top of the drawer you'll find up to two actions:
- Open support ticket — opens Clarity's support form in a new tab if you want help interpreting a diagnosis.
- Manage monitoring location — jumps to this node's location in Monitoring Locations, where the lifecycle actions live. This button is hidden when you're already on the Monitoring Locations page.
Activity
The Activity section tells you whether Clarity Cloud is receiving readings from the device. The pill on the right of the section header shows:
- Online (green check) — the device uploaded a reading at the expected time.
- Offline (red ✕) — the device has not uploaded a reading at the expected time.
Below that, you'll see Last reading received with a relative time (for example "12 minutes ago"). Hover the timestamp to see it in your local time, the network's local time, and UTC.
The bar chart shows the count of readings received per hour over the last 48 hours (axis labels run from -48h to -1h). Hover any bar for a tooltip with the hour range (in your browser's local time) and the number of readings received in that hour.
Operational status
Operational Status breaks the node down into its sub-systems. The pill on the section header shows the overall result — Healthy when everything is OK, or a warning icon when any sub-system has alarms.
Each sub-system is a collapsible panel (they all start collapsed — click a header to expand it). The header shows the sub-system name plus its own status: a green check for OK, or a red warning circle for Alarms. When the node is offline, the icons render in muted grey.
The panels are:
- Internal Sensors — expand to see per-sensor status for Particulate Matter, Nitrogen Dioxide, and Internal Temperature and Relative Humidity, each with its own OK/Alarms icon.
- Power — internal battery charge (%), battery status (e.g. Charging, Normal, or a red recovery mode (Node sampling slowed down) warning), and the power source. If the node was configured with a non-standard power setup, a Configured As line is shown too.
- Communication — the cellular Signal Strength for the node.
- Accessory Modules — if the node has paired modules, a table with one row per module type and columns for Module Type, Paired (the paired module ID), Detected, ID Match, Internal Errors, and Overall status. If nothing is paired, it reads "Node not paired with any accessory."
panels expanded (and a sub-system showing the red Alarms icon) — route
/devices(drawer open)
Alarms
Alarms are based on criteria applied to a period of readings from the device. For example, if at least 25% of the raw PM2.5 mass concentration values exceed 3,000 µg/m³ in the last 3-hour period, an alarm activates. Alarms are re-evaluated periodically and extended if the underlying cause persists. Once the telemetry shows the problem has subsided, the alarm clears automatically.
The Alarms section has two tables, each with a count header:
- N active alarms — alarms still present per the alarm's definition. Columns: Raised at, Last Extended at, Alarm, and Category. Active alarms are tagged red.
- N cleared alarms — alarms that resolved on their own. Columns: Raised at, Cleared at, Alarm, and Category. (An info tooltip next to the heading reminds you that "Alarms automatically cleared when the problem is no longer occurring.")
You can filter either table by Alarm or Category, and sort by the timestamp columns.
To see details on any alarm, click its row. The row expands in place to reveal a description of the alarm, when it was raised / last extended / cleared, how far back the system looked and what percentage of readings triggered it, any affected-module details, and a link to the relevant troubleshooting article.
For the full list of possible alarms and how to troubleshoot them, see the Device Alarms Glossary for Clarity Device Status.
expanded to show inline details — route
/devices(drawer open)
What's next
- Understand common device status alarms.
- Subscribe to device alarms on Dashboard.
- Manage your nodes on Dashboard.
- Get an overview of your network on Live Data.
Was this article helpful?
Yes, thanks! / Not really
Still need a hand? Email us at support@clarity.io or create a support ticket, and our team will get back to you.