What are R² and RMSE?
When you evaluate how well your device matches a reference monitor, two statistics come up again and again: R² and RMSE. This article explains what each one means in plain language, so you can read your device's performance with confidence.
So you know: R² and RMSE are most useful together. Once you've got the basics here, see using R² and RMSE together.
R² (the correlation coefficient)
R² — often written "r-squared" — measures how well two datasets correlate. Here, it tells you how well your sensor's measurements track a reference monitor's measurements when both monitor the same place over the same period.
Think of R² as answering: when the reference monitor sees concentrations going up, does the sensor see them going up too?
- R² ranges from
0to1and has no units. - An R² close to
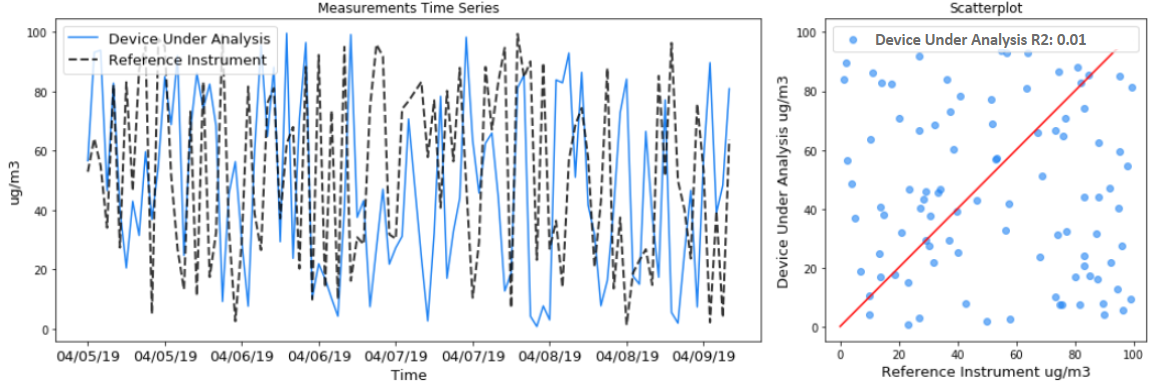
1means good correlation. On a scatter plot of the two monitors, the points lie roughly along a line. - An R² close to
0means poor correlation. The points look scattered randomly, with no clear trend.
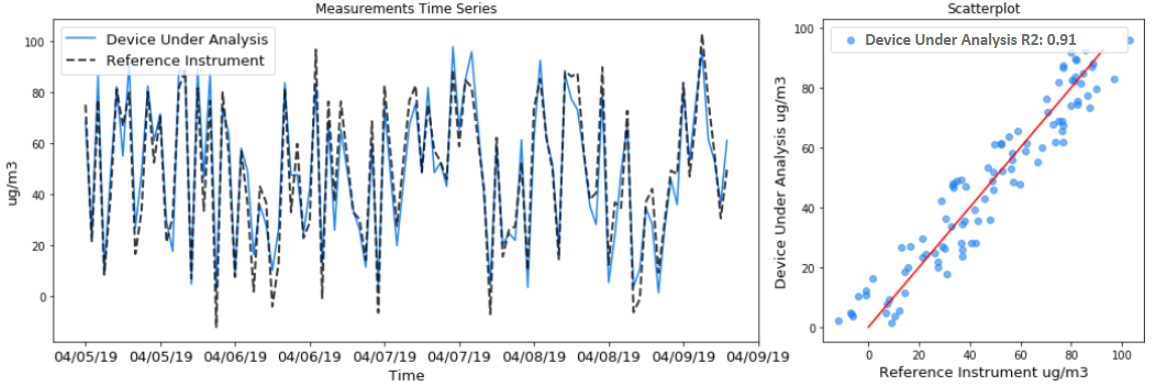
A high R² means you can trust that when your sensor measures an increase or decrease, that reflects a real change in the air — and that the change is proportionally consistent with reality. For example, if your sensor reads double yesterday's concentration, a good R² gives you confidence the concentration really did double.
RMSE (root mean square error)
Where R² is about correlation, RMSE is about the difference between the two datasets. It quantifies the error between your sensor and the reference monitor — the average magnitude of the gap between their values.
- RMSE ranges from
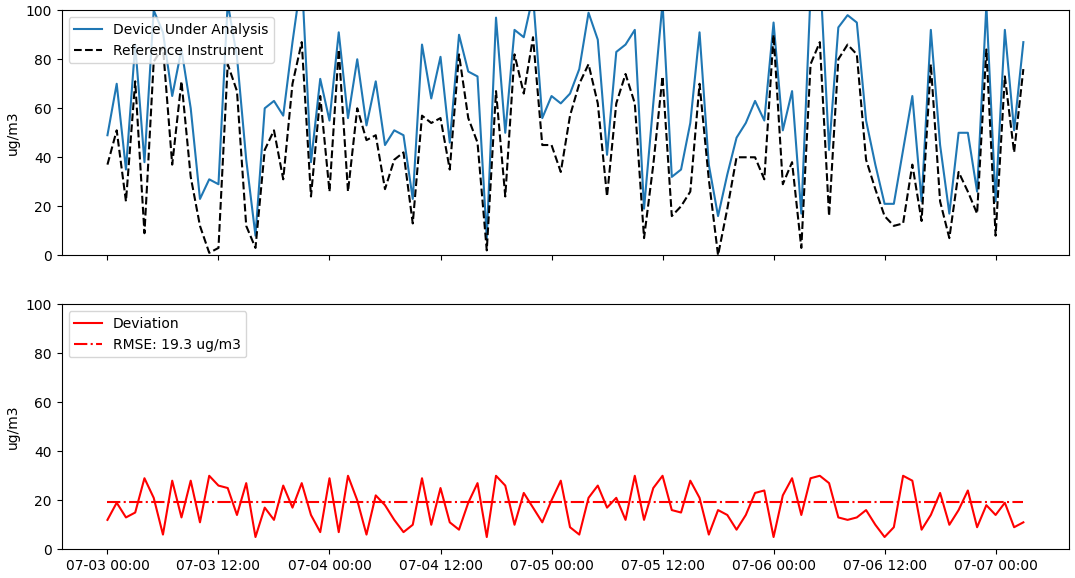
0to infinity, and carries the same unit as the pollutant concentration. - A low RMSE means a smaller difference between sensor and reference — better performance.
- A high RMSE means a larger difference — worse performance.
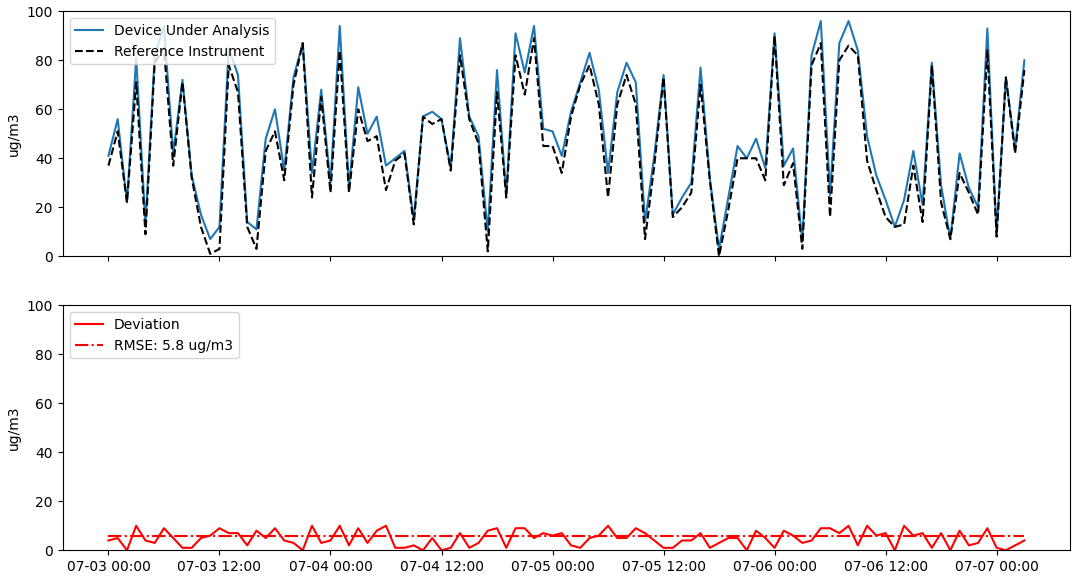
Because RMSE shares the pollutant's units, it's easy to interpret. If you're comparing PM2.5 from a sensor and a reference monitor, an RMSE of 5 µg/m³ means that, on average, the sensor was 5 micrograms off from the reference.
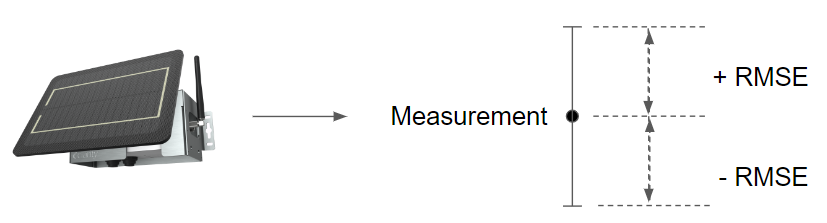
For example, if your RMSE is 5 µg/m³ and your device reads 59 µg/m³, the actual concentration is most likely between 54 and 64 µg/m³.
Knowing your RMSE helps you read changes. For the device above, a 3 µg/m³ increase might just be noise, since the sensor can be off by 5 µg/m³. But a 15 µg/m³ increase is more trustworthy as a real change, because it's larger than the RMSE.
RMSE vs. MAE
Mean Absolute Error (MAE) is another way to quantify how far your sensor's measurements deviate from the reference.
The difference is in the math: RMSE is the square root of the average of the squared differences, while MAE is the average of the absolute differences. Because RMSE squares the differences first, it gives more weight to larger errors, making it more sensitive to them than MAE.
The distinction is subtle. For evaluating sensor performance, the two can be used interchangeably — they very often come out to about the same value.
What's next
- Using R² and RMSE together to evaluate sensor performance
- Compare your collocated device to a reference monitor
Was this article helpful?
Yes, thanks! / Not really
Still need a hand? Email us at support@clarity.io or create a support ticket, and our team will get back to you.