An overview of your network on Live Data
The Live Data page is your real-time snapshot of the whole monitoring network.
Note: After you configure your first node, it can take up to an hour before its first measurements appear on Live Data.
The Live Data page shows the latest reading from every running monitoring location on an interactive map (or sortable table), alongside a summary panel that rolls the network up into a few key numbers: how many locations you have, how their air quality is distributed right now, how healthy the devices are, and which alarms are firing.
How to get here: in the left sidebar, open the Air quality group and click Live Data (it's the first item, marked with a pulsing "Live" badge once the page loads).

What you see at a glance
Live Data has three regions:
- A map or table filling most of the screen, with one marker (or row) per monitoring location, coloured by its latest measurement.
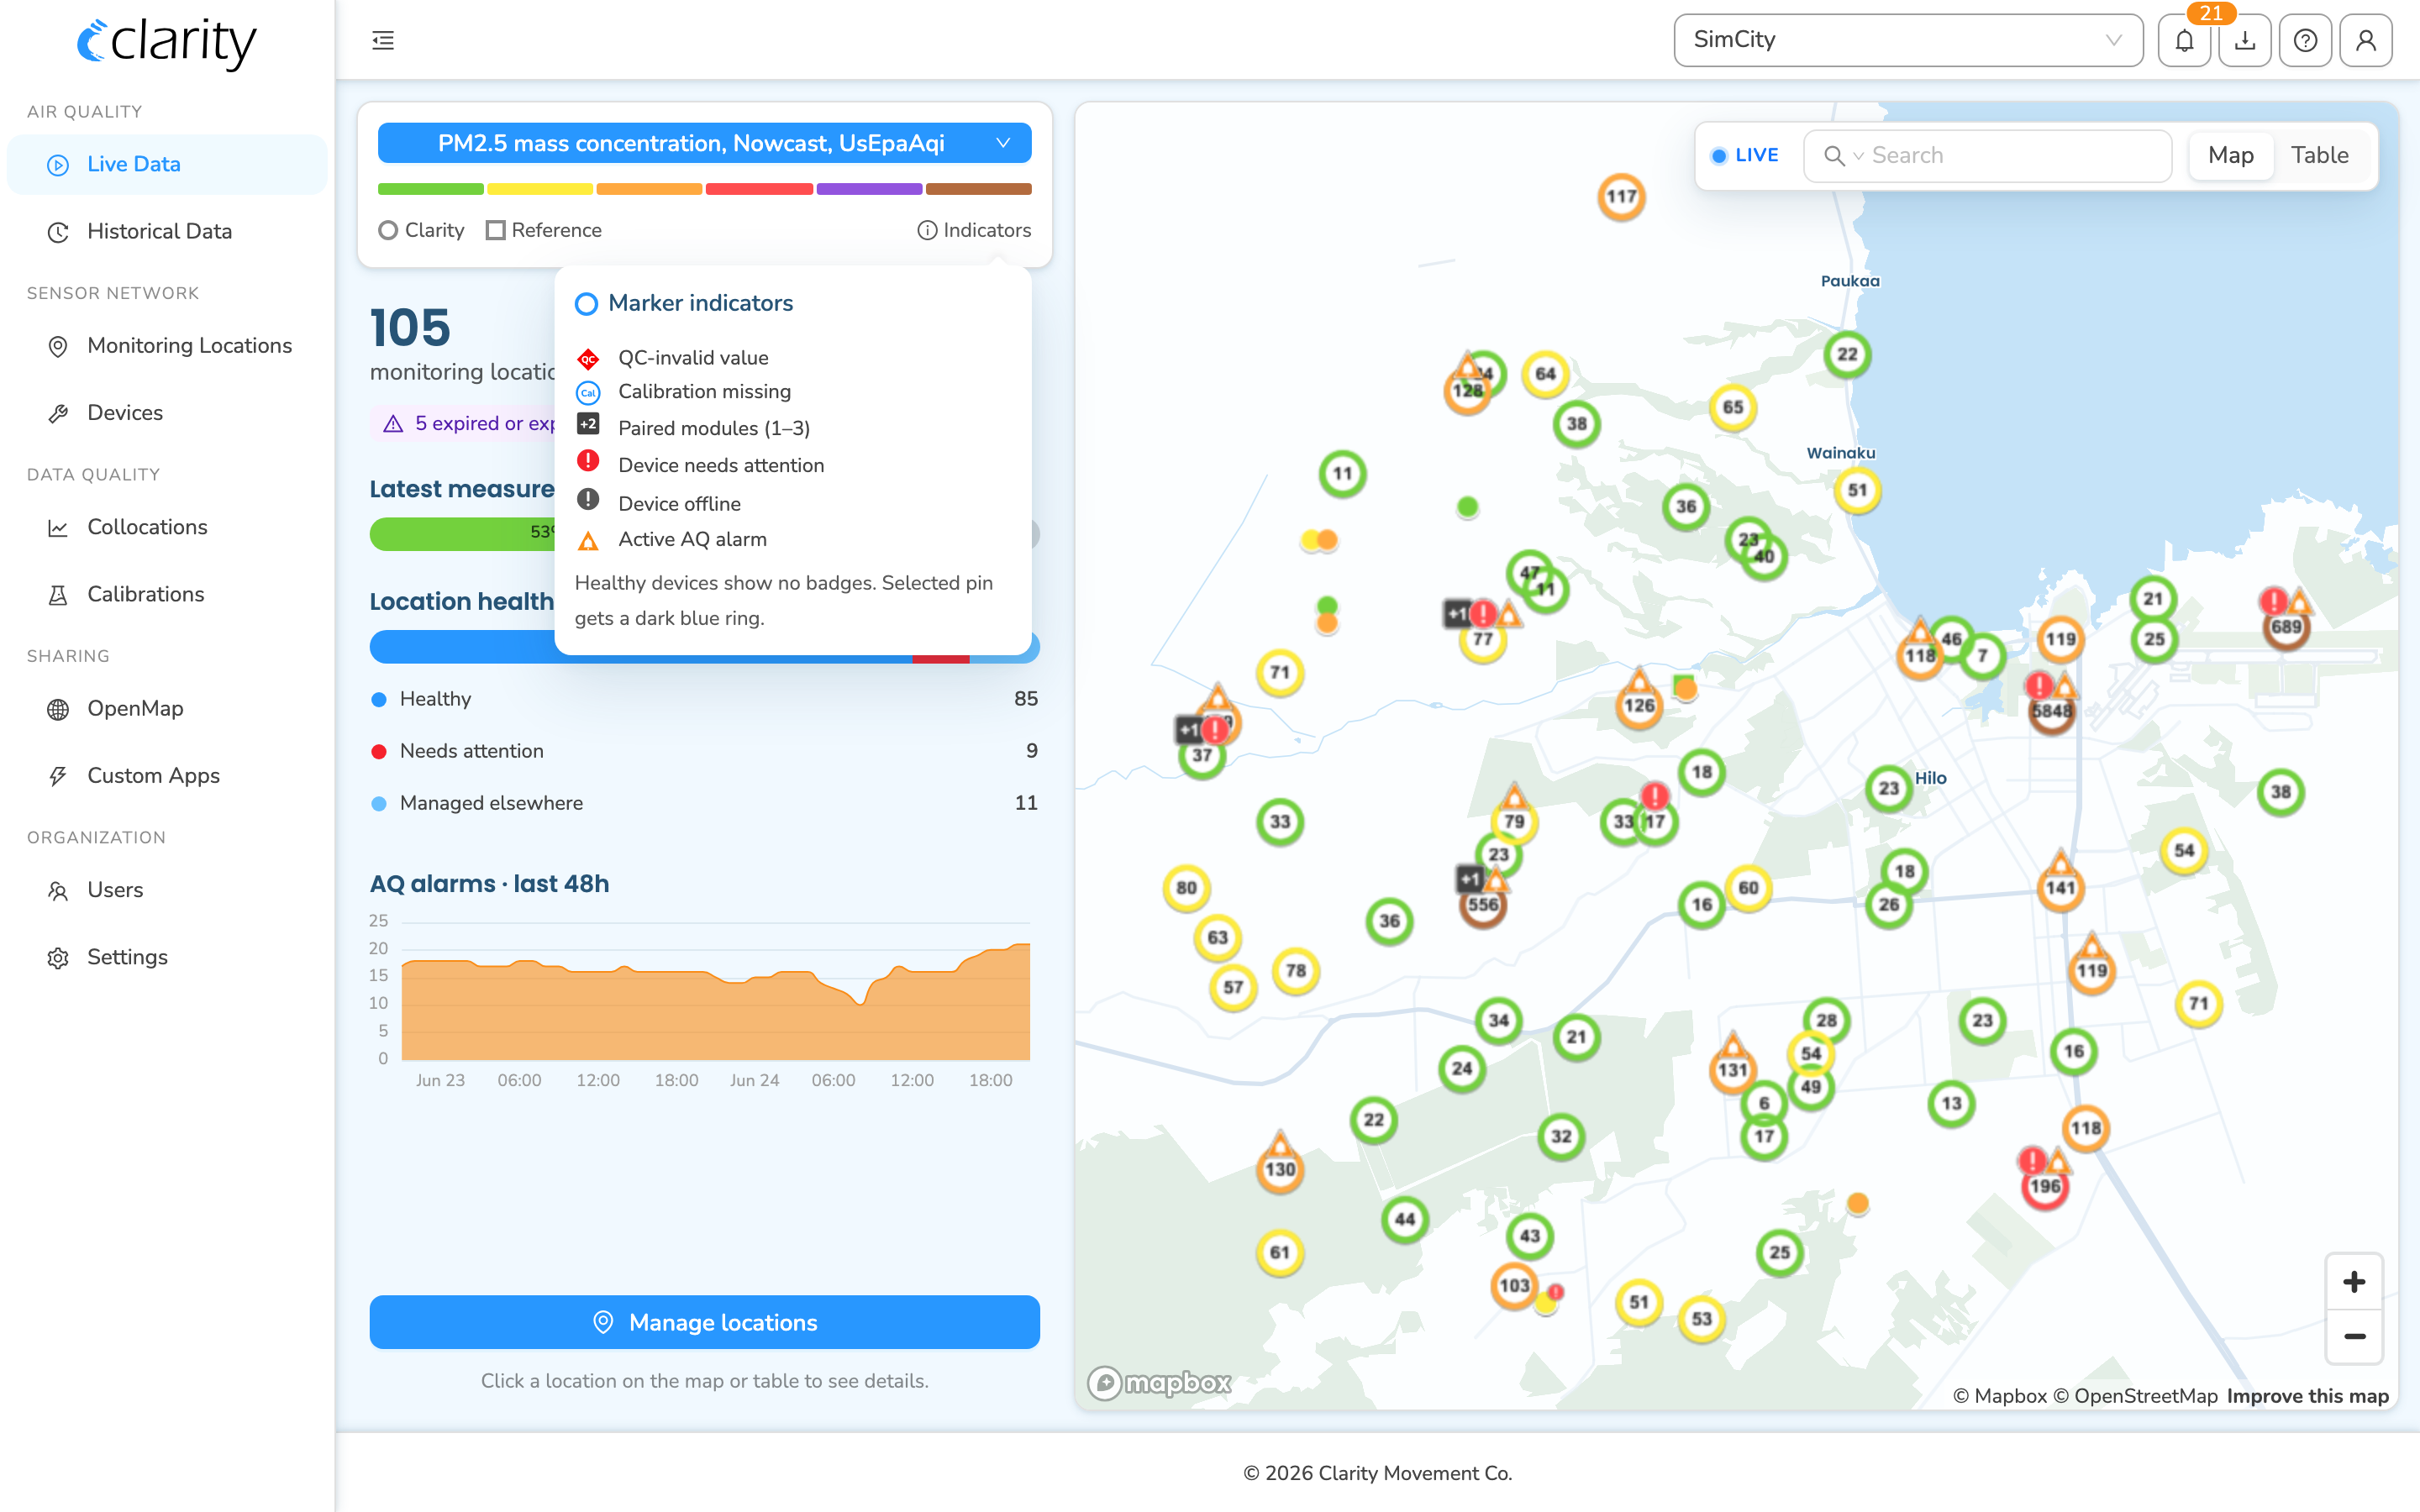
- A control card at the top of the left column, where you pick the pollutant/metric, product family, and read the colour and indicator legends.
- A summary sidebar below the control card. Before you select anything it shows the whole-network rollup; click a location and it switches to that location's details.
In the top-right corner there's a floating toolbar with a search box, the pulsing Live badge, and a Map / Table toggle.
Heads up — this is the "right now" lens. Live Data only shows locations that are currently running. Stopped or not-yet-deployed locations don't appear here; you'll find those on Monitoring Locations and Devices (both under the Sensor network sidebar group).
Choosing what the map shows
The control card at the top of the left column drives the colours and values everywhere on the page:
- Metric picker — choose the pollutant and metric, for example PM2.5 NowCast AQI or a raw concentration. Markers, the table's Latest measurement column, and the summary strip all recolour to match.
- Product family — narrow to a device/product family when your network mixes hardware types.
- Colour legend — the bin scale (e.g. AQI categories, good → hazardous) used to colour every marker and value.
- Shape legend and Indicators — hover Indicators to see what the marker badges mean (QC-invalid value, calibration missing, paired modules, device needs attention, device offline, active AQ alarm). Healthy devices show no badges.
Reading the map
Each running location is a marker, coloured by its latest value on the selected metric. Markers also carry small badges for anything that needs attention.
- Zoomed out, nearby markers cluster and collapse to simple dots; a location with any problem (offline, needs attention, or a QC-invalid value) carries a single consolidated issue badge.
- Zoom in and markers show the full per-location indicator row (QC, calibration-missing, paired-module count, attention, offline, active alarm).
- Hover a marker for a small card with the location name, its latest reading, and a line per active indicator.
- Click a clustered marker to spread it open ("spider"), then click an individual marker inside to select it. A lone marker selects immediately.
- The selected location gets a dark-blue ring, and the left sidebar switches to its details. Press Esc (or the ✕ in the sidebar) to clear the selection.
Switching to the table
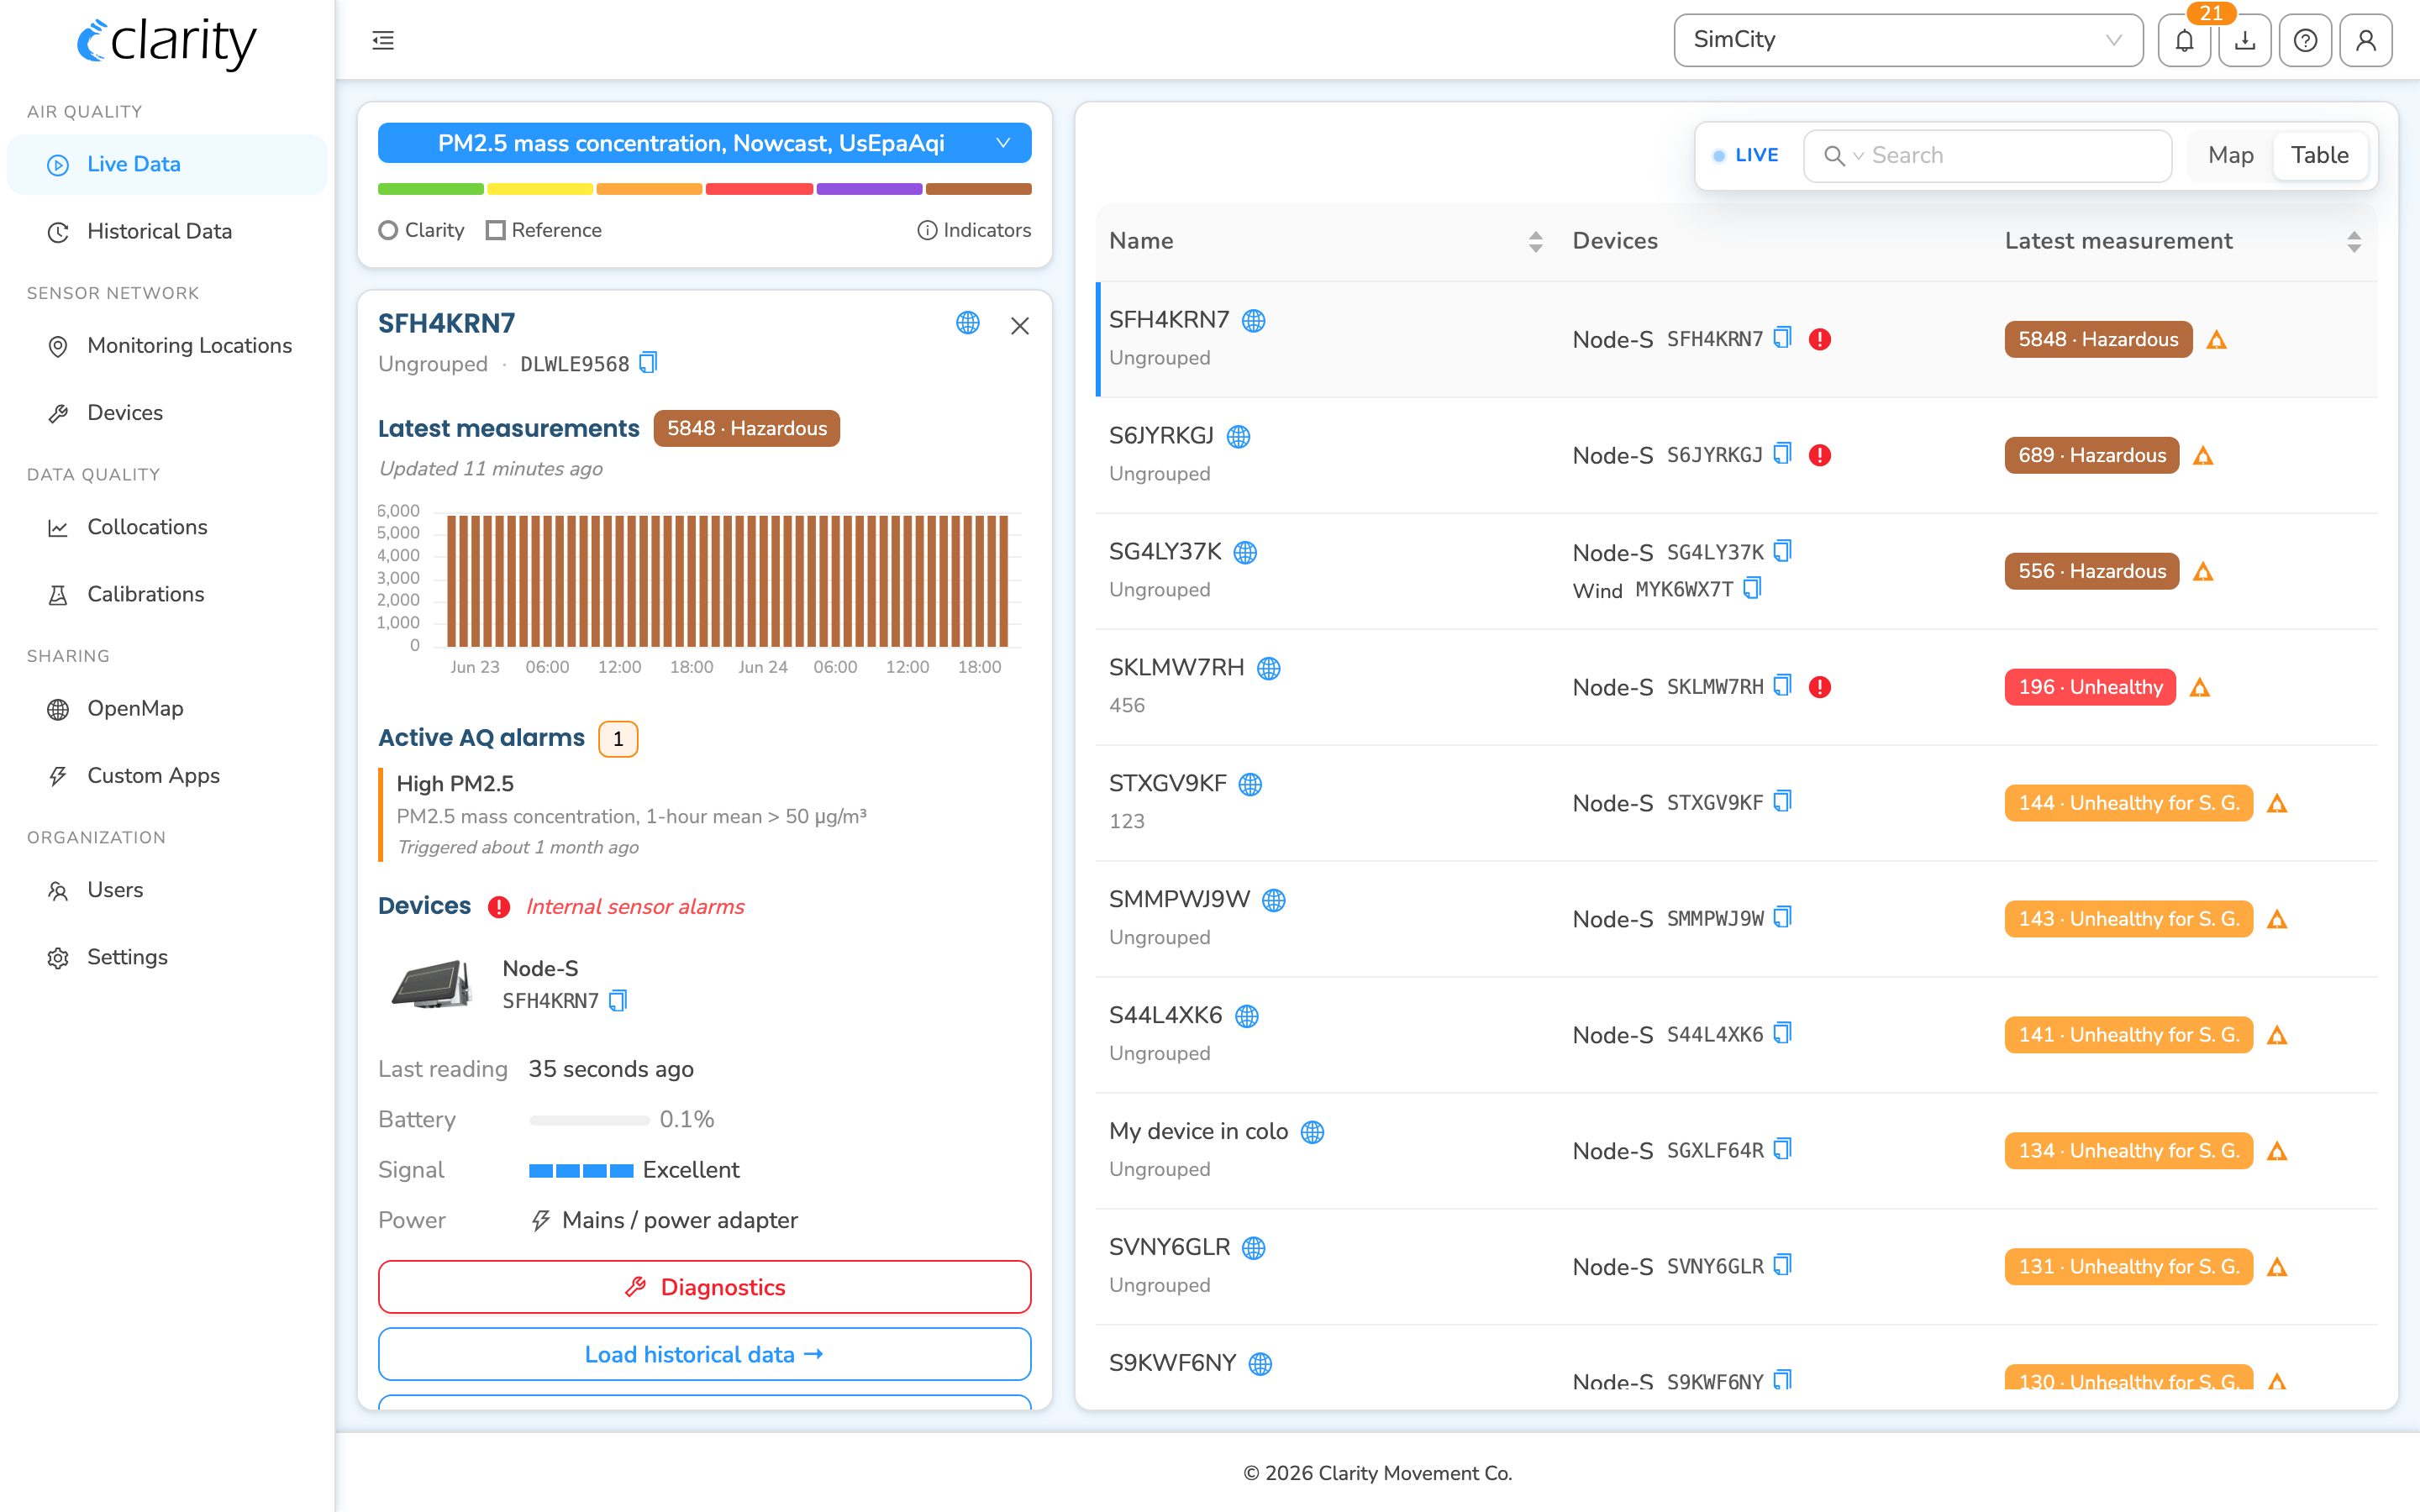
Use the Map / Table toggle in the top-right toolbar to swap the map for a sortable table. Columns:
- Name — location name and group.
- Devices — the attached node and any paired modules, with a health dot.
- Latest measurement — the latest value coloured by the same bin scale, plus QC / calibration / alarm badges. The table is pre-sorted by latest value (highest first); click any column header to re-sort.
Click a row to select that location and open its details in the left sidebar (the same selection the map uses).
Searching and filtering
- Search box (top-right): matches by name, group, tag, or ID — and IDs can be a datasource (
D…), node (A…), or paired module (M…). A small scope picker inside the box narrows the match to a single field (e.g. group only or tag only). - Location health filter (in the summary sidebar): click a health row — Healthy, Needs attention, Offline, or Managed elsewhere — to narrow the map and table to just those locations. Click the active row again, or Clear filter in the section header, to lift it.
The network summary (nothing selected)
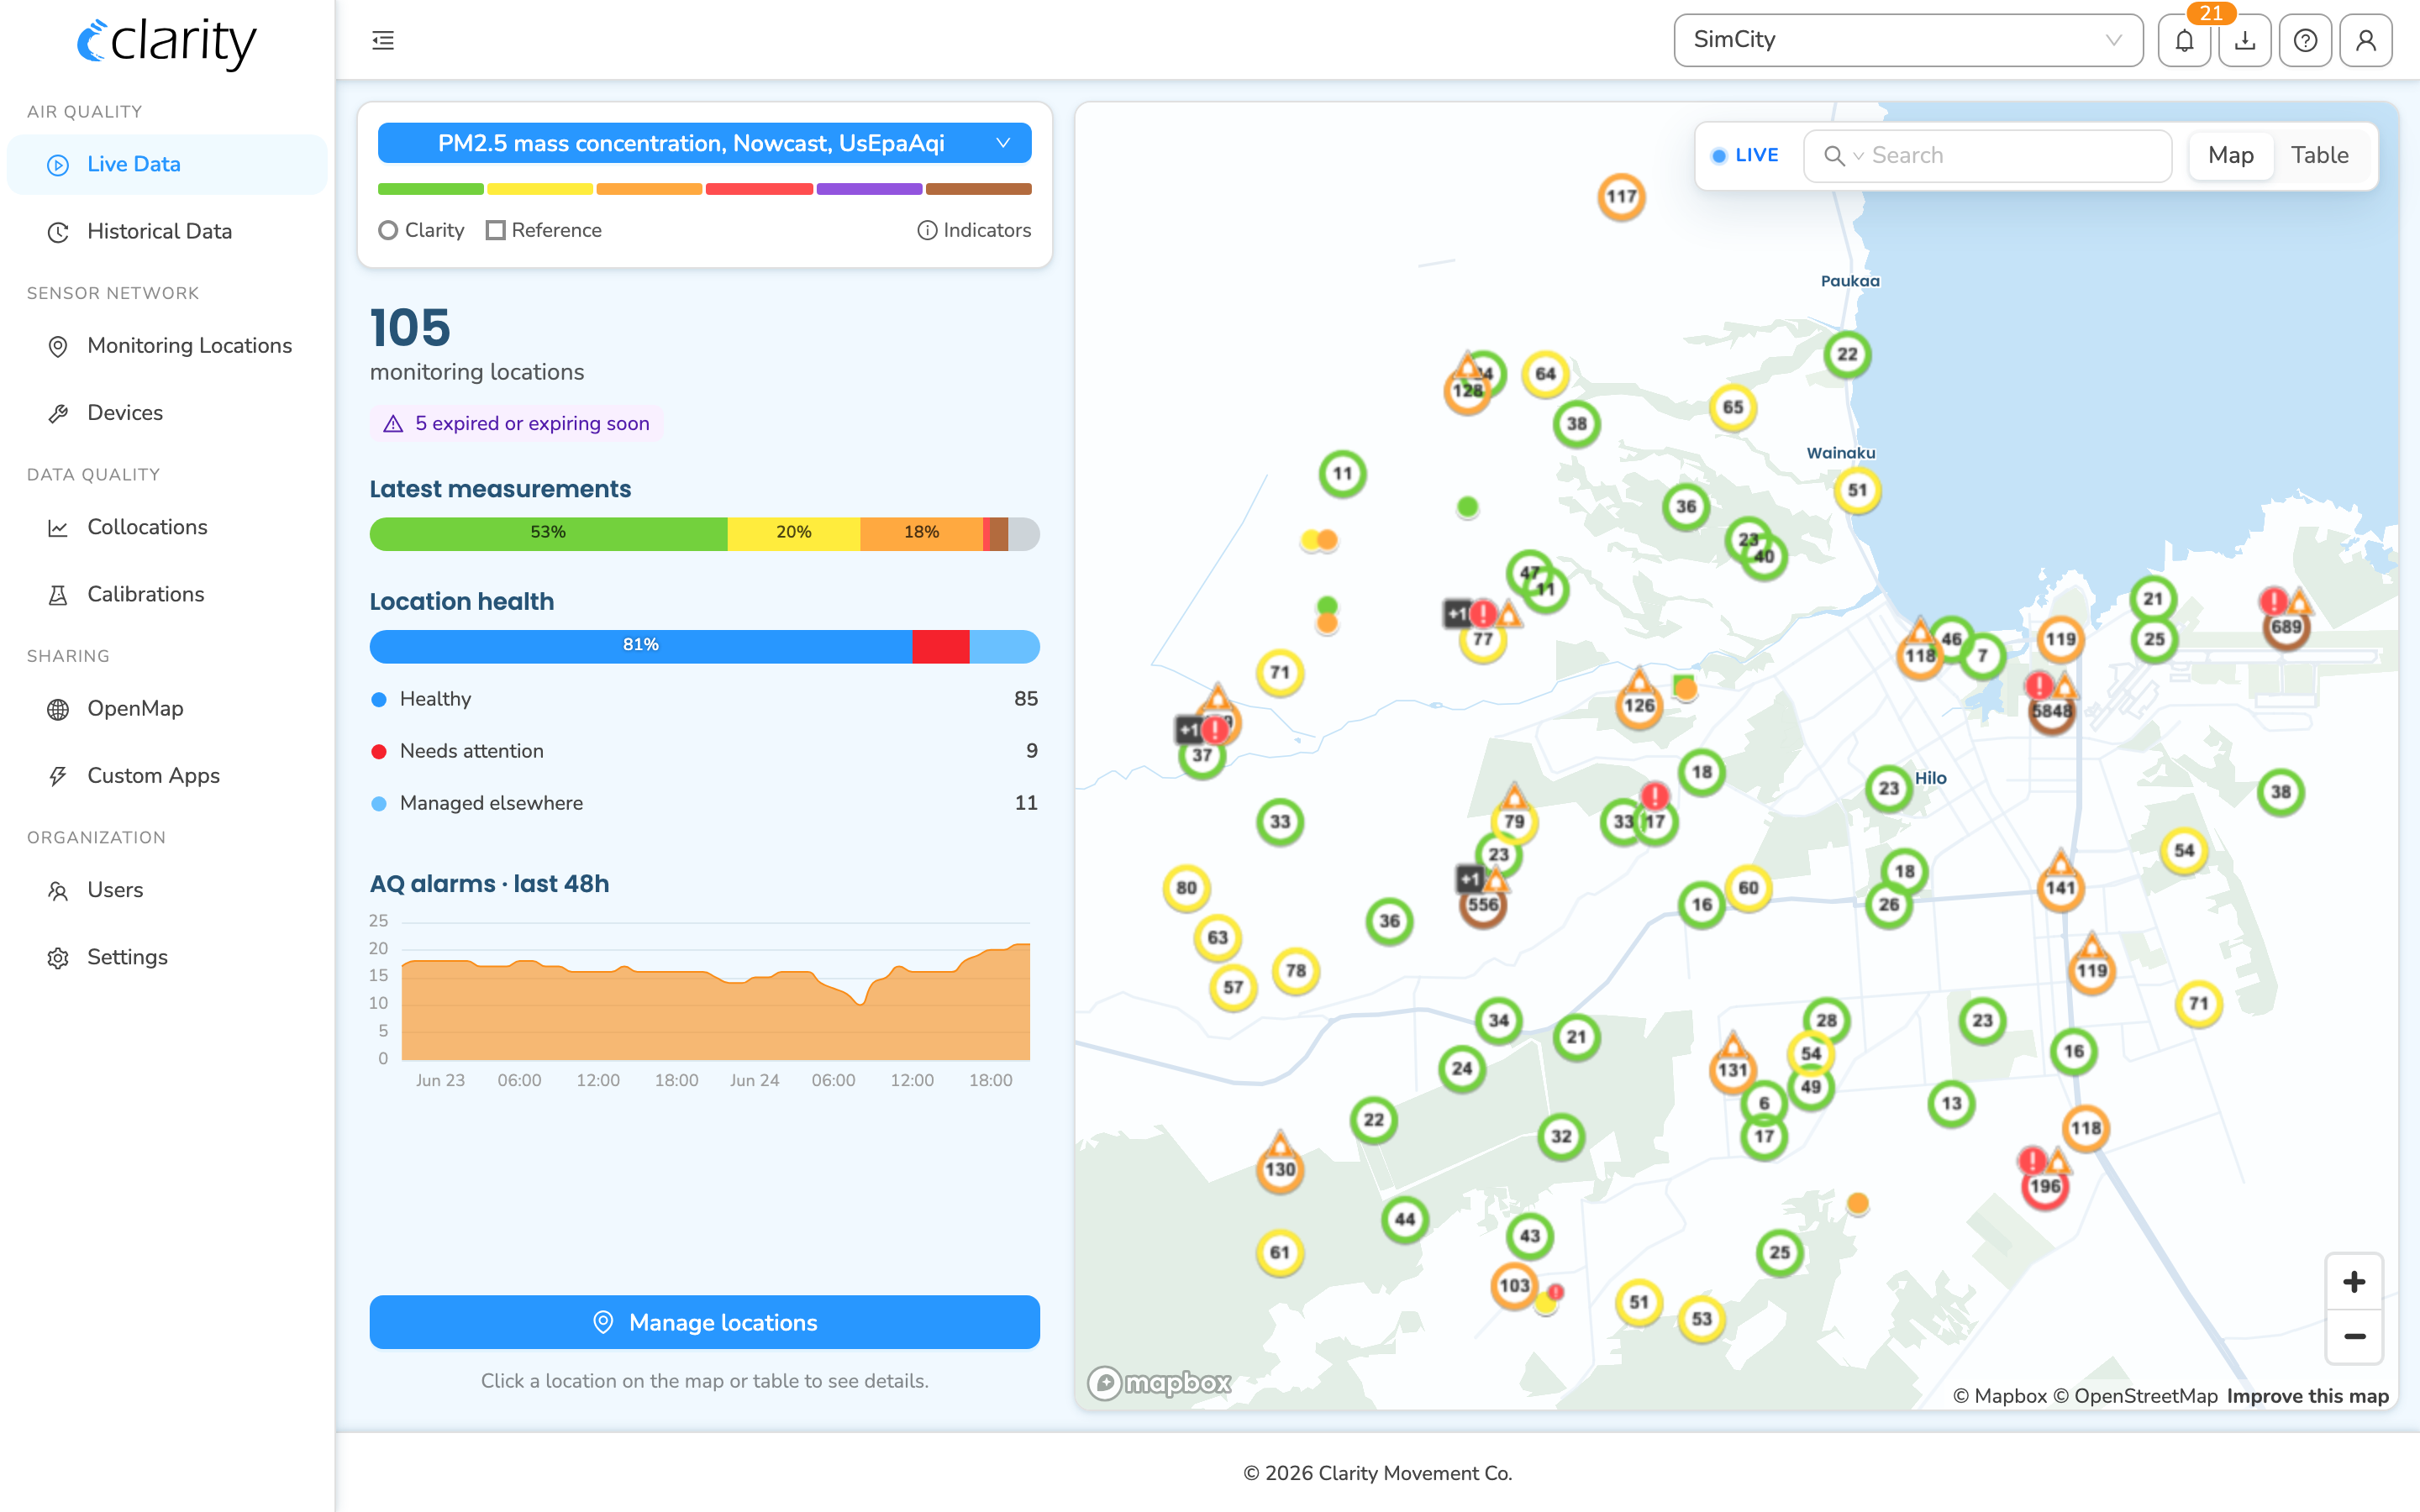
When no location is selected, the left sidebar rolls the whole (search-filtered) network into one panel:
- The headline number — how many monitoring locations you have. If any subscriptions are expired or expiring soon, a purple chip appears here; clicking it jumps to Monitoring Locations pre-filtered to those at-risk locations.
- Latest measurements — a 100%-stacked strip showing what share of the network is currently in each air-quality band (with a grey tail for locations that have no current reading). Hover a segment for the count and percentage.
- Location health — a matching strip plus a row per health bucket (Healthy / Needs attention / Offline / Managed elsewhere) with counts. Each row doubles as the health filter described above.
- AQ alarms · last 48h — a small chart of how many locations have been alarming over the last 48 hours, broken down by rule. If you have no alarm rules yet, this shows a Create button that takes you to AQ Alarms.
- Manage locations — a button that opens the full Monitoring Locations workspace (shown only to users who can manage locations).
Drilling into a single location
Click a marker or table row and the left sidebar becomes that location's detail card:
- Identity header — name, group, and the datasource ID (click to copy). An OpenMap badge shows if the location is already shared publicly.
- Latest measurements — the current value (coloured by band), an "Updated …" line, and a 48-hour history sparkline whose bars are coloured by band; any alarm thresholds are drawn as dashed lines, and QC-invalid readings get a small red diamond.
- Active alarms — listed only when something is currently firing on this location.
- Device block — the attached node and paired modules, power source, and current health, with these actions underneath:
- Diagnostics — opens the diagnostics drawer for the attached node. (If the node is configured but hasn't reported yet, this is instead a Check deployment status button.)
- Share on OpenMap — appears when the location is one you manage and isn't already public; opens the OpenMap sharing dialog.
- Load historical data and Manage monitoring location — quick links to pivot this same location into another view. Load historical data opens a small dialog to pick a time range and frequency, then loads Historical Data; Manage monitoring location jumps to the Monitoring Locations workspace. ("Open in Live Data" is hidden here because you're already on it.)

When you have no monitoring locations yet
If the organization has no monitoring locations, the left column shows a short empty state with an Add a monitoring location button (it opens the add-location flow on Monitoring Locations), and the map shows a "No monitoring locations" note over the backdrop.
What's next
- Explore the device Diagnostics view.
- Manage your nodes on Dashboard.
- Name, group and tag your monitoring locations.
- Get a tour of Clarity Cloud software.
Was this article helpful?
Yes, thanks! / Not really
Still need a hand? Email us at support@clarity.io or create a support ticket, and our team will get back to you.