Node management on Dashboard
The Node-S is the building block of Clarity's Sensing-as-a-Service. It's built to withstand harsh weather over years in the field, and it houses the power, connectivity, and protection for a range of low-cost sensors that monitor particulate matter, nitrogen dioxide, temperature, and relative humidity. You can extend a Node-S with add-on Modules (for example Multi-Gas or Black Carbon).
This article walks through managing your nodes from the Clarity Dashboard: where to find them, how to deploy (configure) a node, how to pair modules, and how to run the lifecycle actions — replace, change power, edit details, and stop a monitoring location.
Node management is split across two pages — the Devices page (your hardware inventory and deployed nodes) and the Monitoring Locations page (the running and stopped locations your nodes feed).
Finding your nodes
The left sidebar is grouped into sections. Node management lives under SENSOR NETWORK:
- Monitoring Locations — the locations your nodes record to.
- Devices — every node and module your organization owns.
Other groups you'll see in the sidebar: AIR QUALITY (Live Data, Historical Data), DATA QUALITY (Collocations, Calibrations), SHARING (OpenMap, Custom Apps), and ORGANIZATION (Users, Settings).
Understanding the Devices page
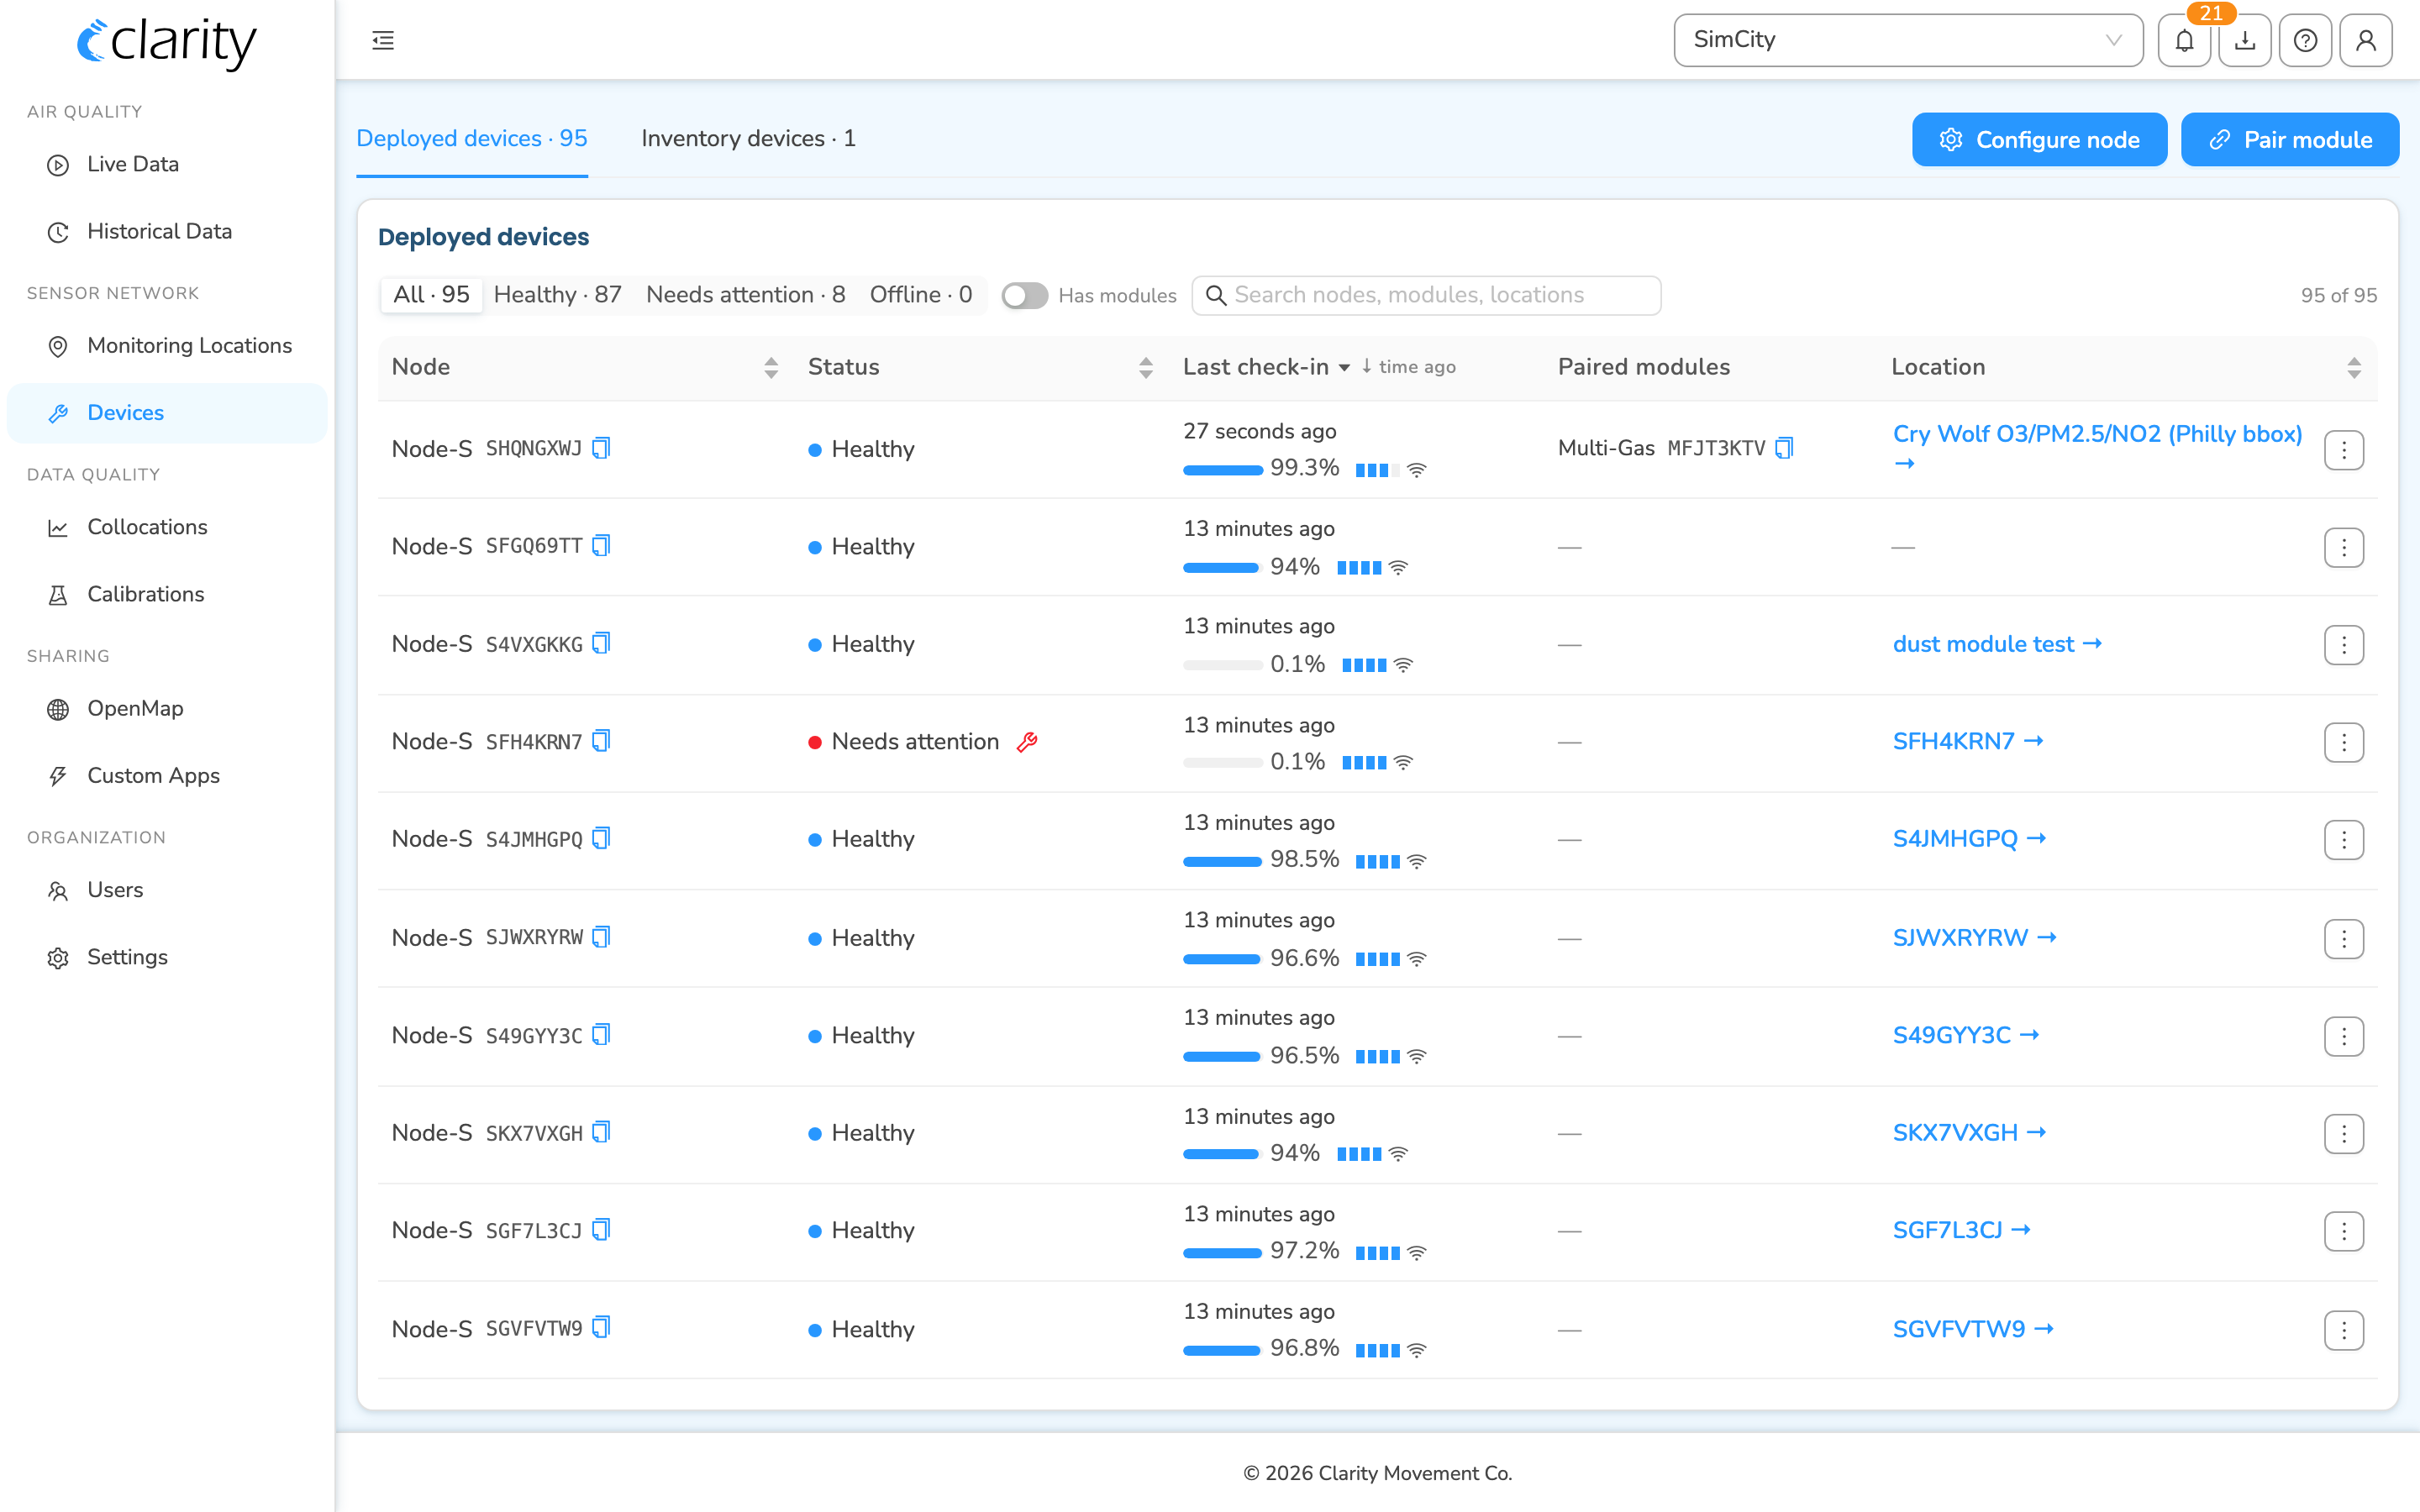
The Devices page is a single unified view of all the hardware your organization owns, split into two tabs at the top:
- Deployed devices — nodes that are configured and reporting (or recently reported) to Clarity Cloud. Each row shows the node, its health status, last check-in (with battery and signal), any paired modules, and the monitoring location it feeds. The tab label carries the count, e.g. Deployed devices · 95.
- Inventory devices — nodes and unpaired modules that are ready to deploy or pair. The tab label carries the count, e.g. Inventory devices · 1.
Above the tabs, two buttons are always available in the top-right:
- Configure node — starts the node deployment wizard.
- Pair module — starts the module-pairing wizard.
Both buttons require an org admin or technician role. If you don't have one, the buttons are disabled with a tooltip explaining why — contact your org admin.
The Deployed devices tab
Each deployed row carries a row-actions menu — the ⋮ (kebab) icon at the right edge of the Location column. It contains:
- Diagnostics — opens the per-node diagnostics drawer (activity, sensor and module status, alarms).
- Manage monitoring location — jumps to this node's location on the Monitoring Locations page, where the lifecycle actions live.
- Open in Live Data — opens the node's measurements in Live Data.
- Load historical data — opens the node's data in Historical Data.
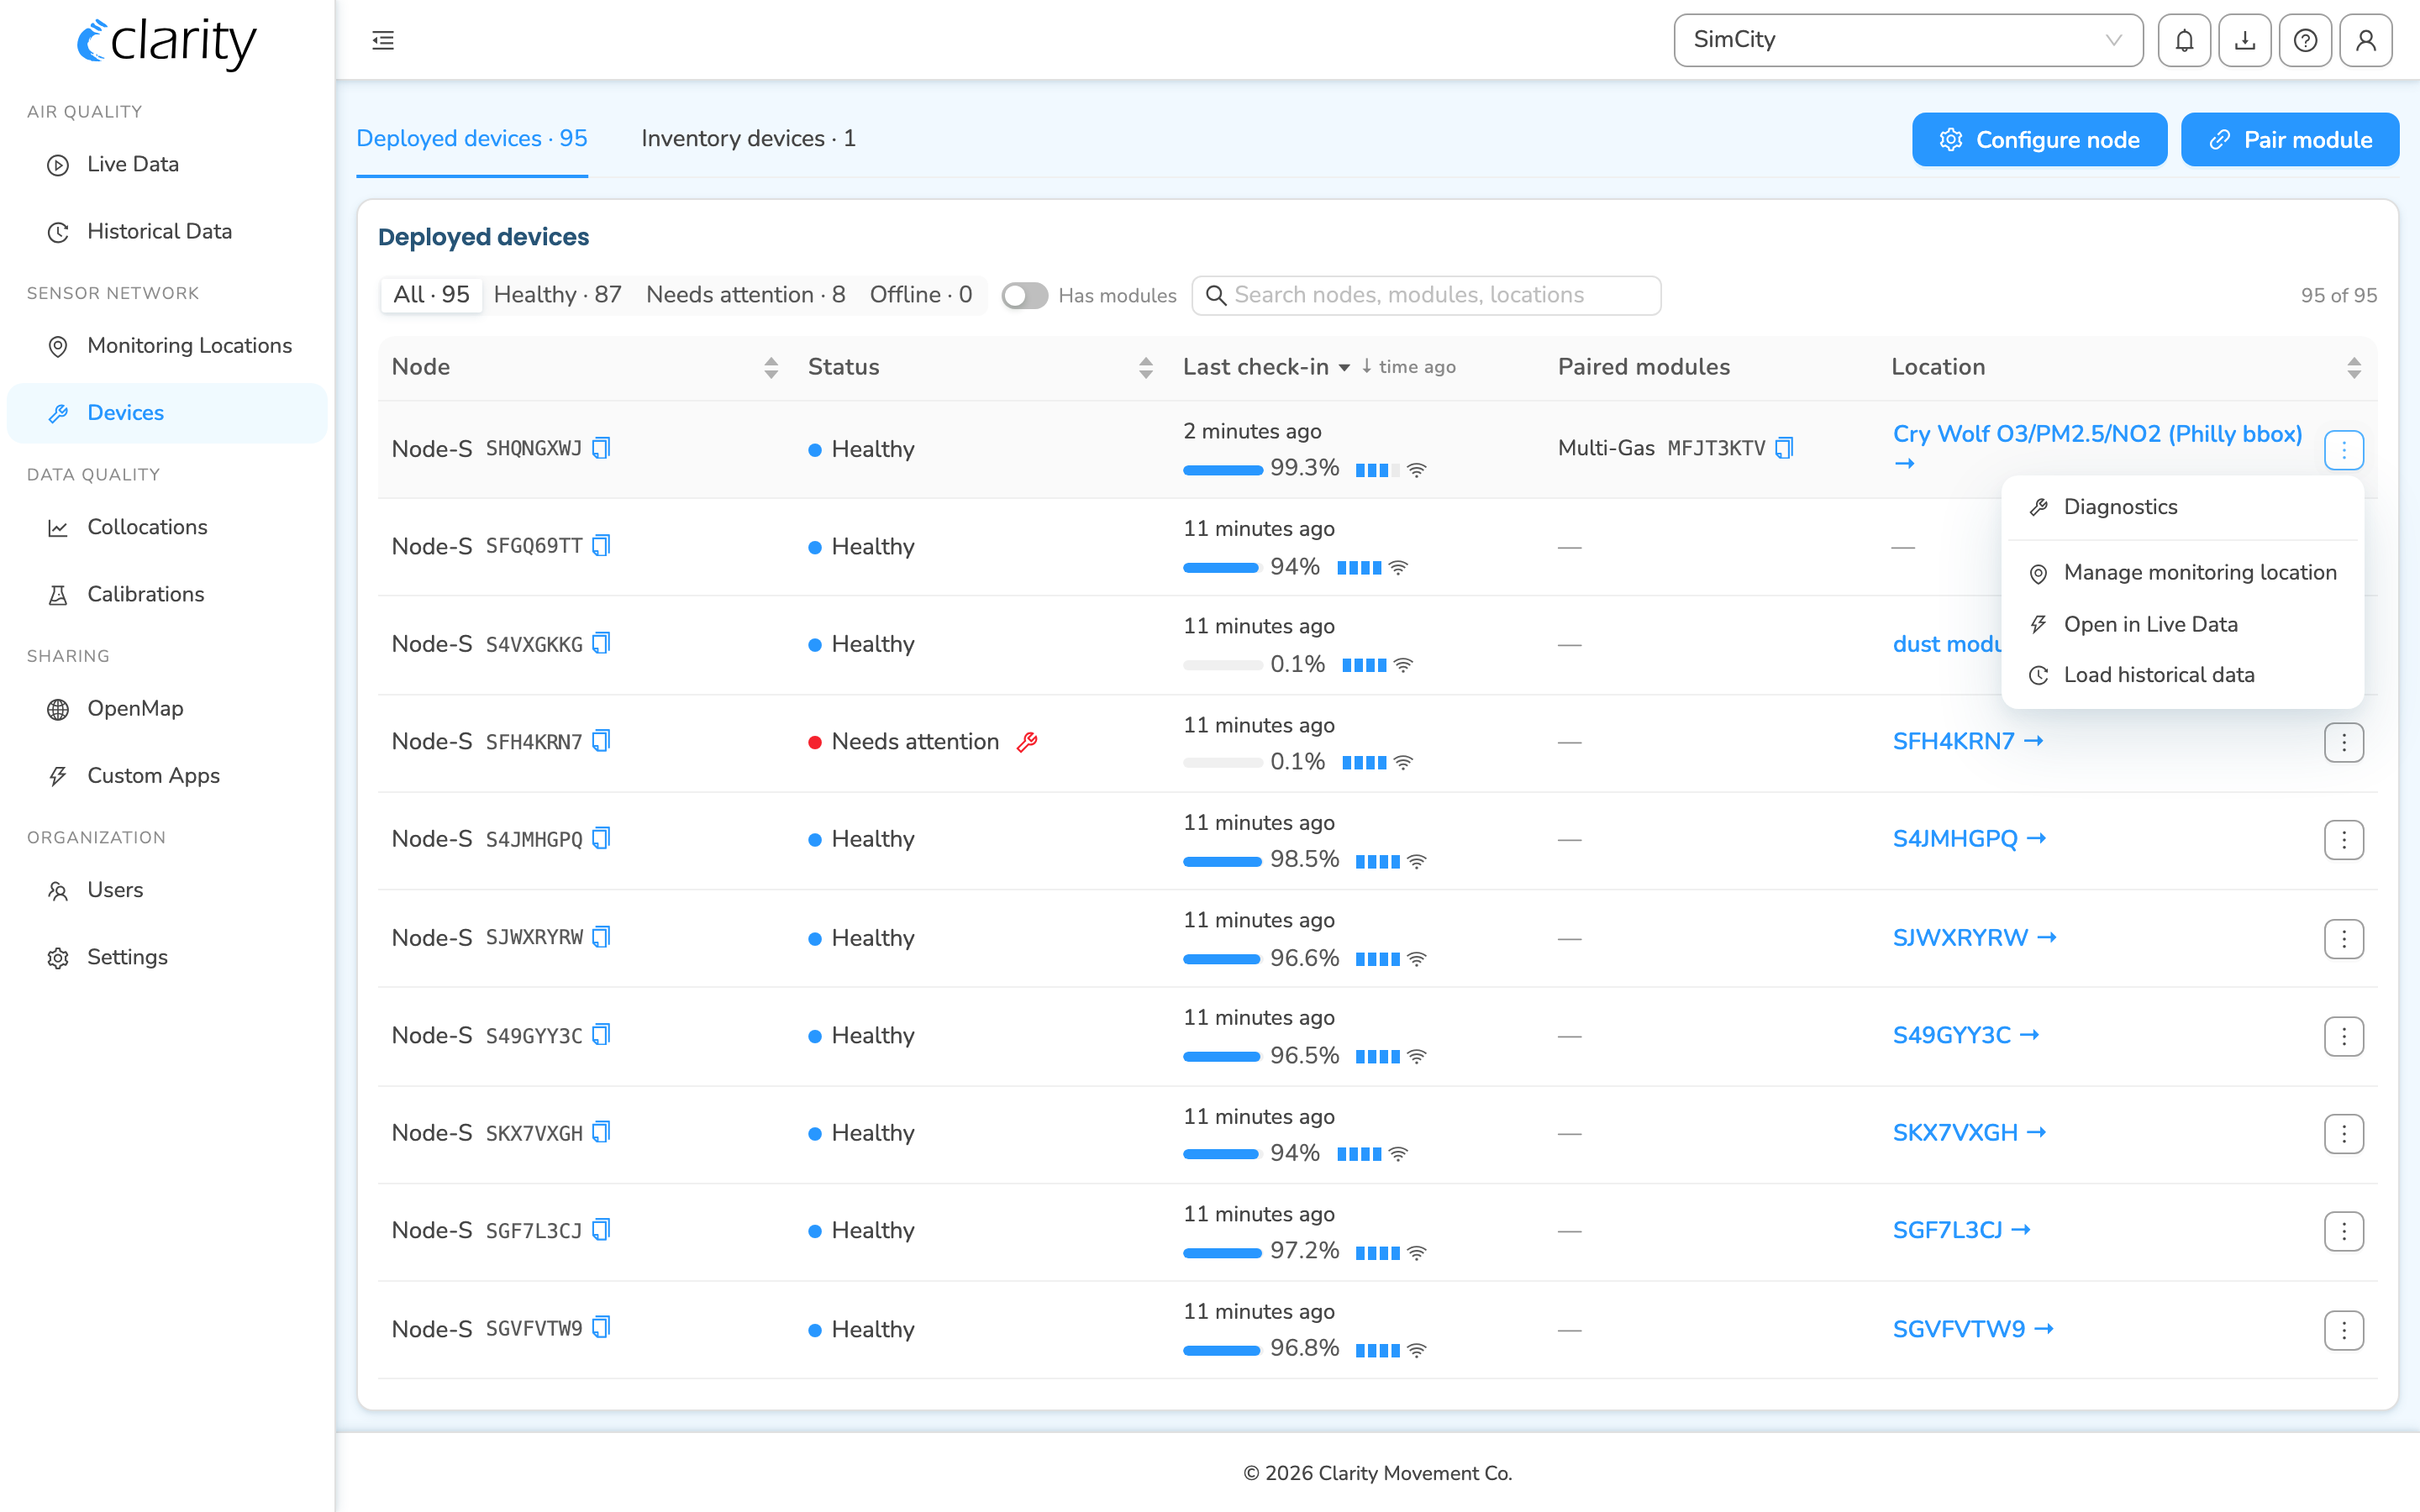
On rows that need attention or are offline, a wrench shortcut also appears next to the status dot for one-click Diagnostics. The location name in the Location column is itself a link to Monitoring Locations.
Note: Stop, Replace, Edit, Change power, and Pair/Unpair all live on the location's card in Monitoring Locations (open it via Manage monitoring location). Compatible modules lives on the Inventory devices tab. See the relevant sections below.
The Inventory devices tab
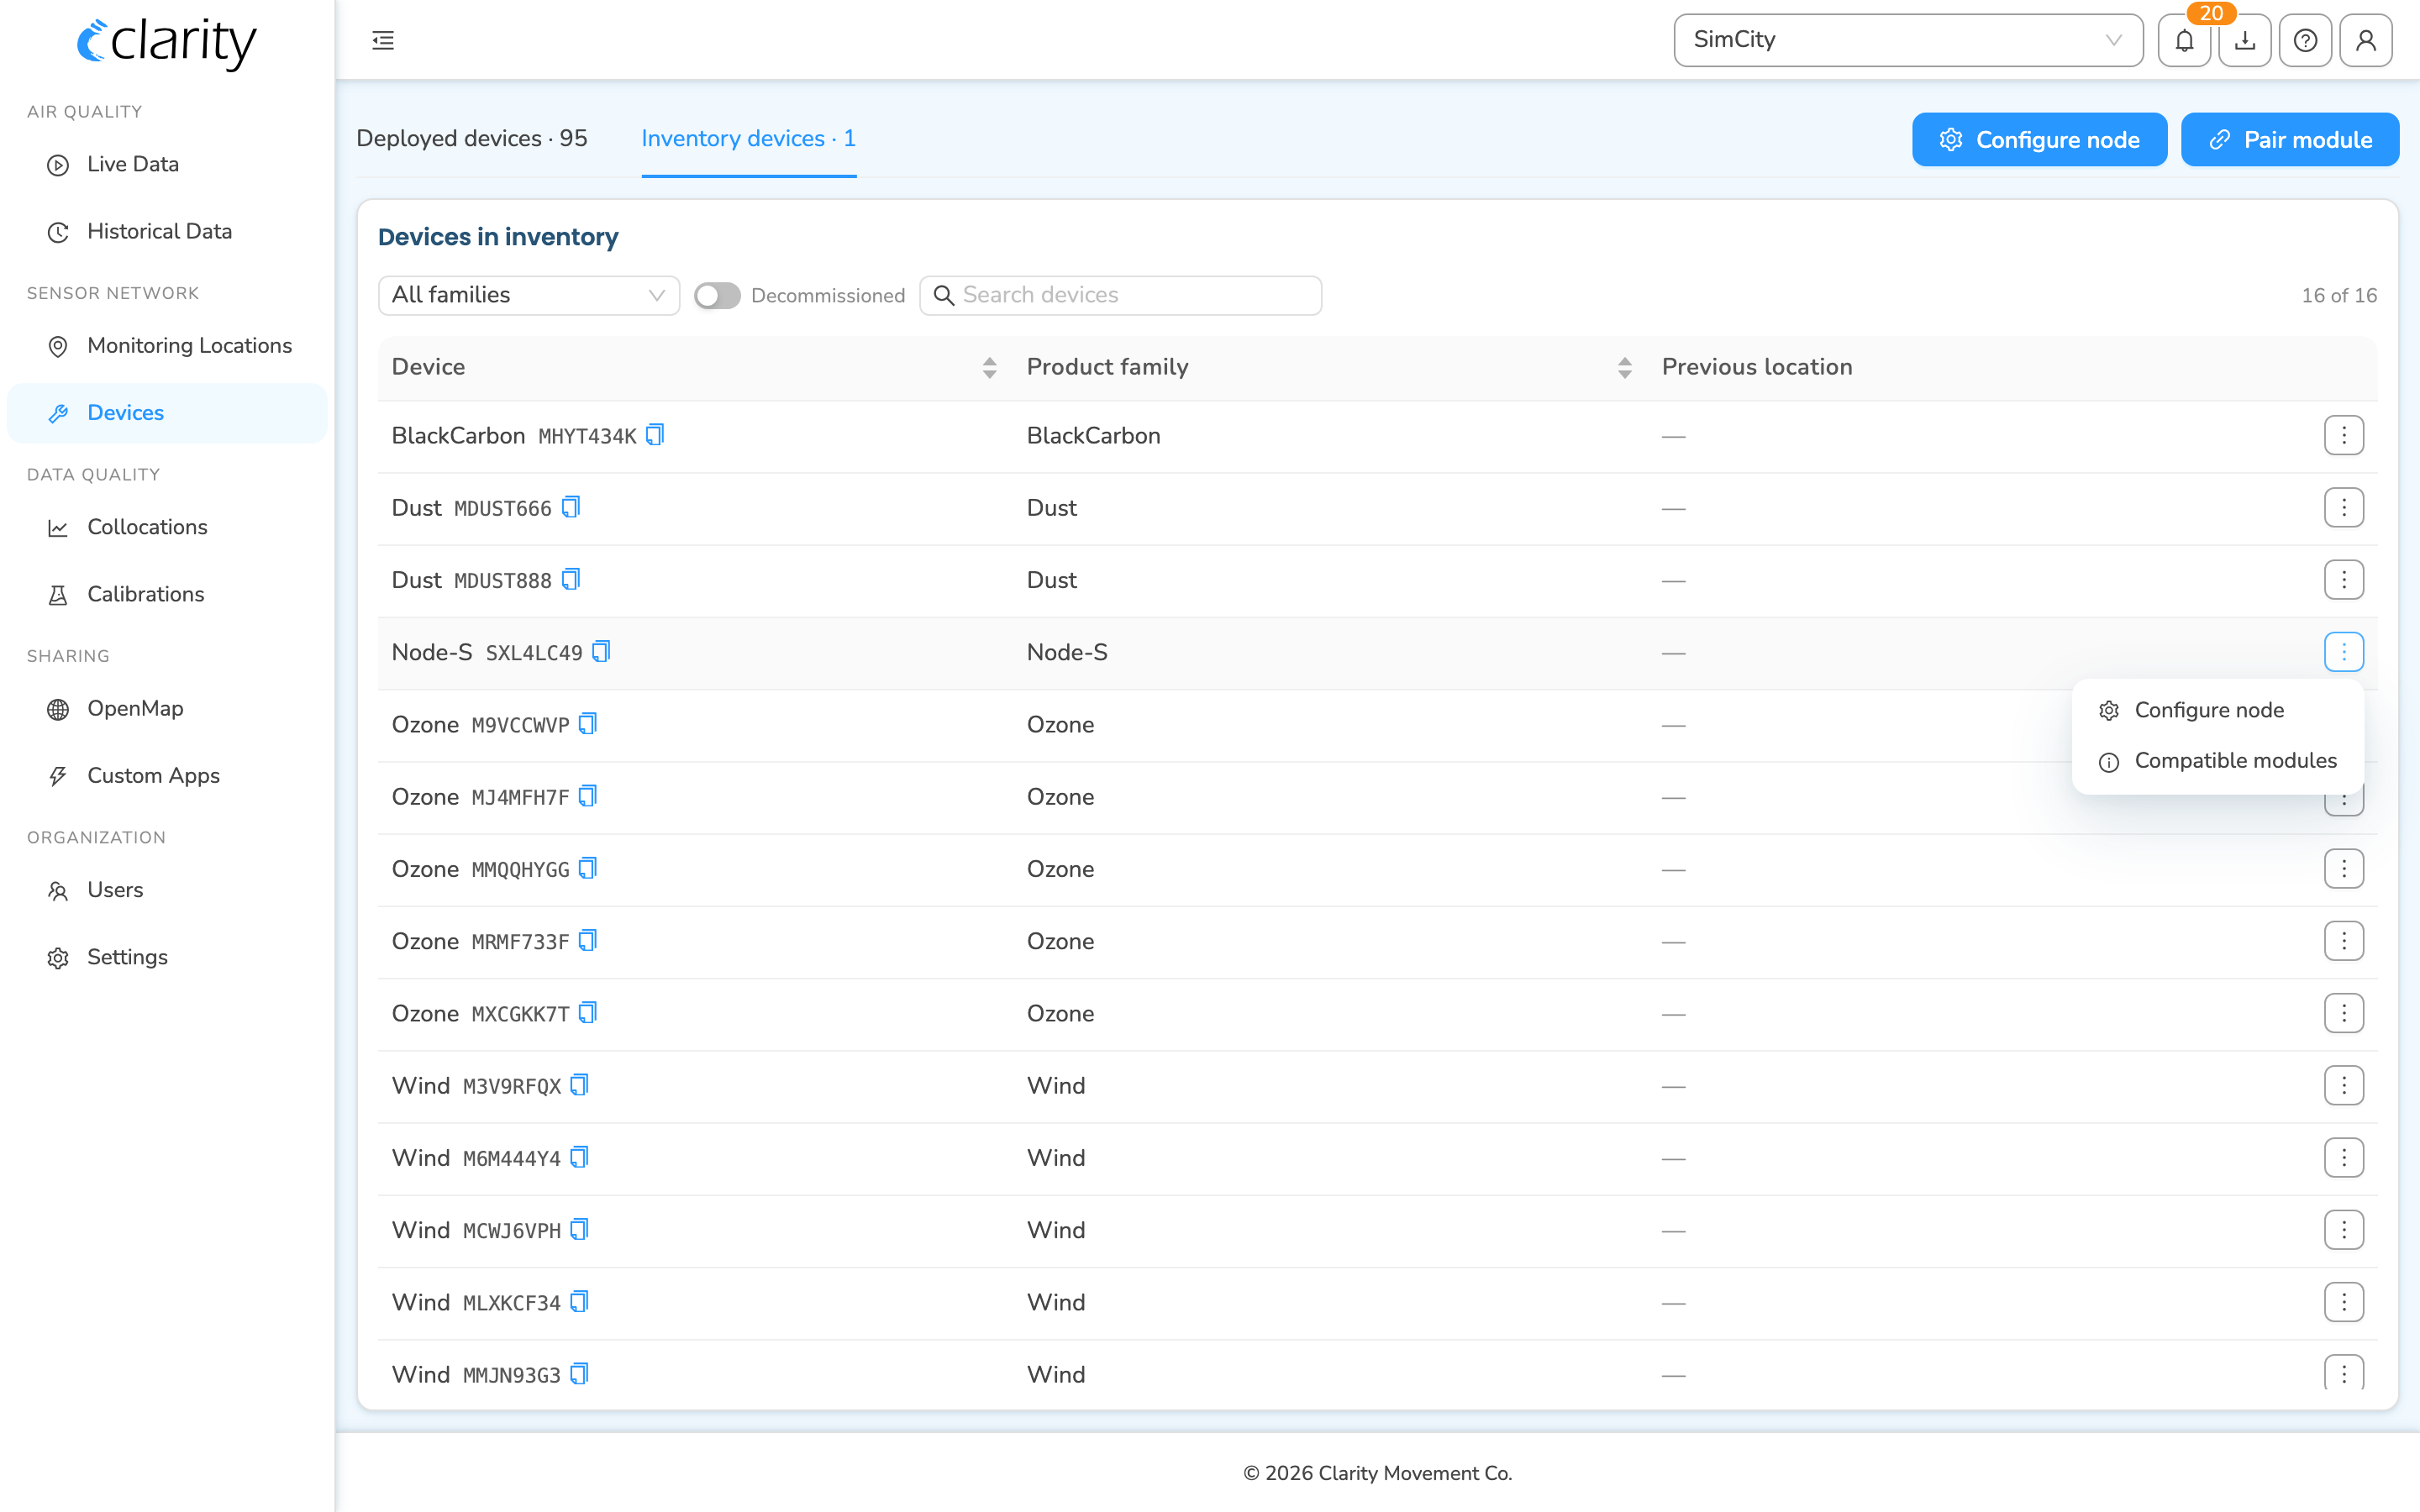
The Inventory tab lists standalone nodes (purchased, not yet deployed) and unpaired modules. You can filter by product family, search, and toggle Decommissioned to include retired nodes (read-only).
Each inventory row has a ⋮ menu:
- For a node: Configure node (opens the deployment wizard pre-seeded with that node) and Compatible modules (lists module types that pair with this node).
- For a module: Pair module (opens the pairing wizard pre-seeded with that module) and Compatible nodes (lists nodes this module can pair with).
Understanding the Monitoring Locations page
Monitoring Locations is where you manage the locations your nodes record to. The left column has a control card that splits locations into Running and Stopped, with quick refinements for Running (Healthy, Needs attention, Offline, Expiring soon, Managed elsewhere). The right pane shows the locations as a Table or a Map (toggle top-right).
Click a location in the table (or a marker on the map) to open its detail card in the left column. That card is the home for the node lifecycle actions.
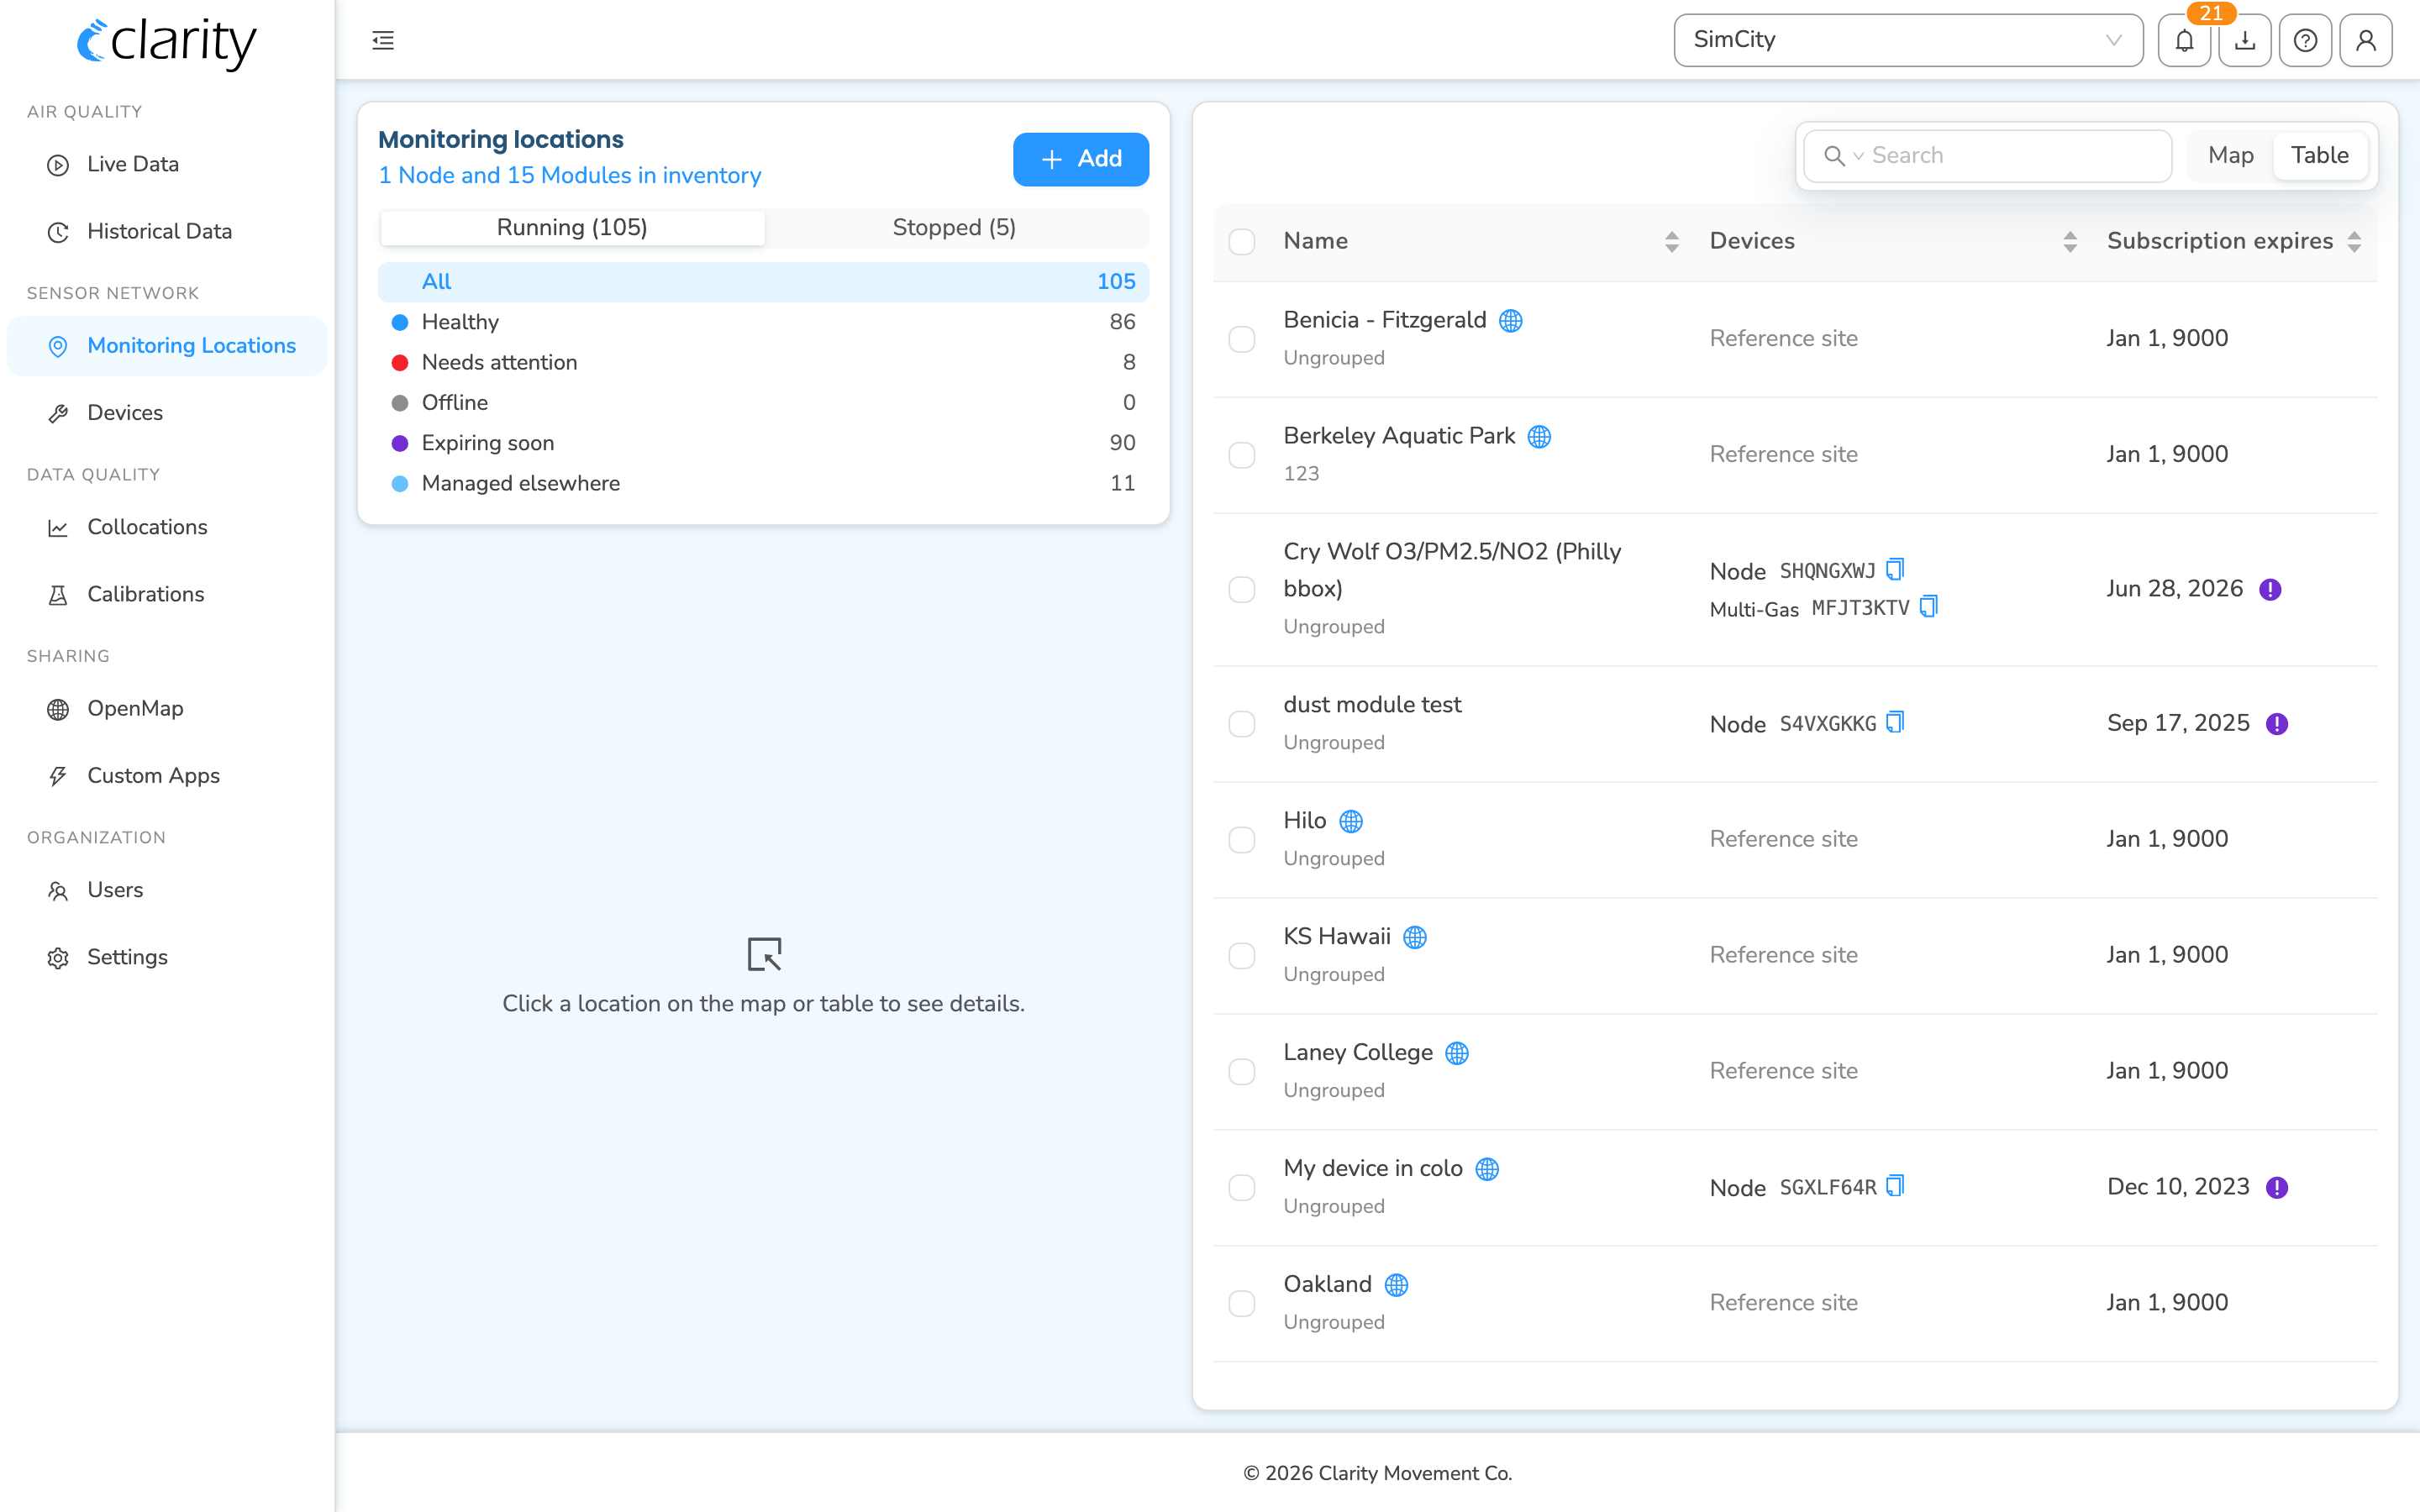
To add to your network, use the + Add button. Depending on your role you'll either pick between Deploy a Clarity node, Pair a module, and Subscribe to a reference monitor, or go straight to the inventory picker.
Configuring (deploying) a node
Configuration assigns a node to a location, creates a new monitoring location to stream its measurements, and establishes secure communication with Clarity Cloud.
To start the wizard, either:
- Scan the QR code on the node, or
- Open Devices, click Configure node (top-right), and pick a node from inventory, or
- Open Devices → Inventory devices, find the node, and choose Configure node from its ⋮ menu.
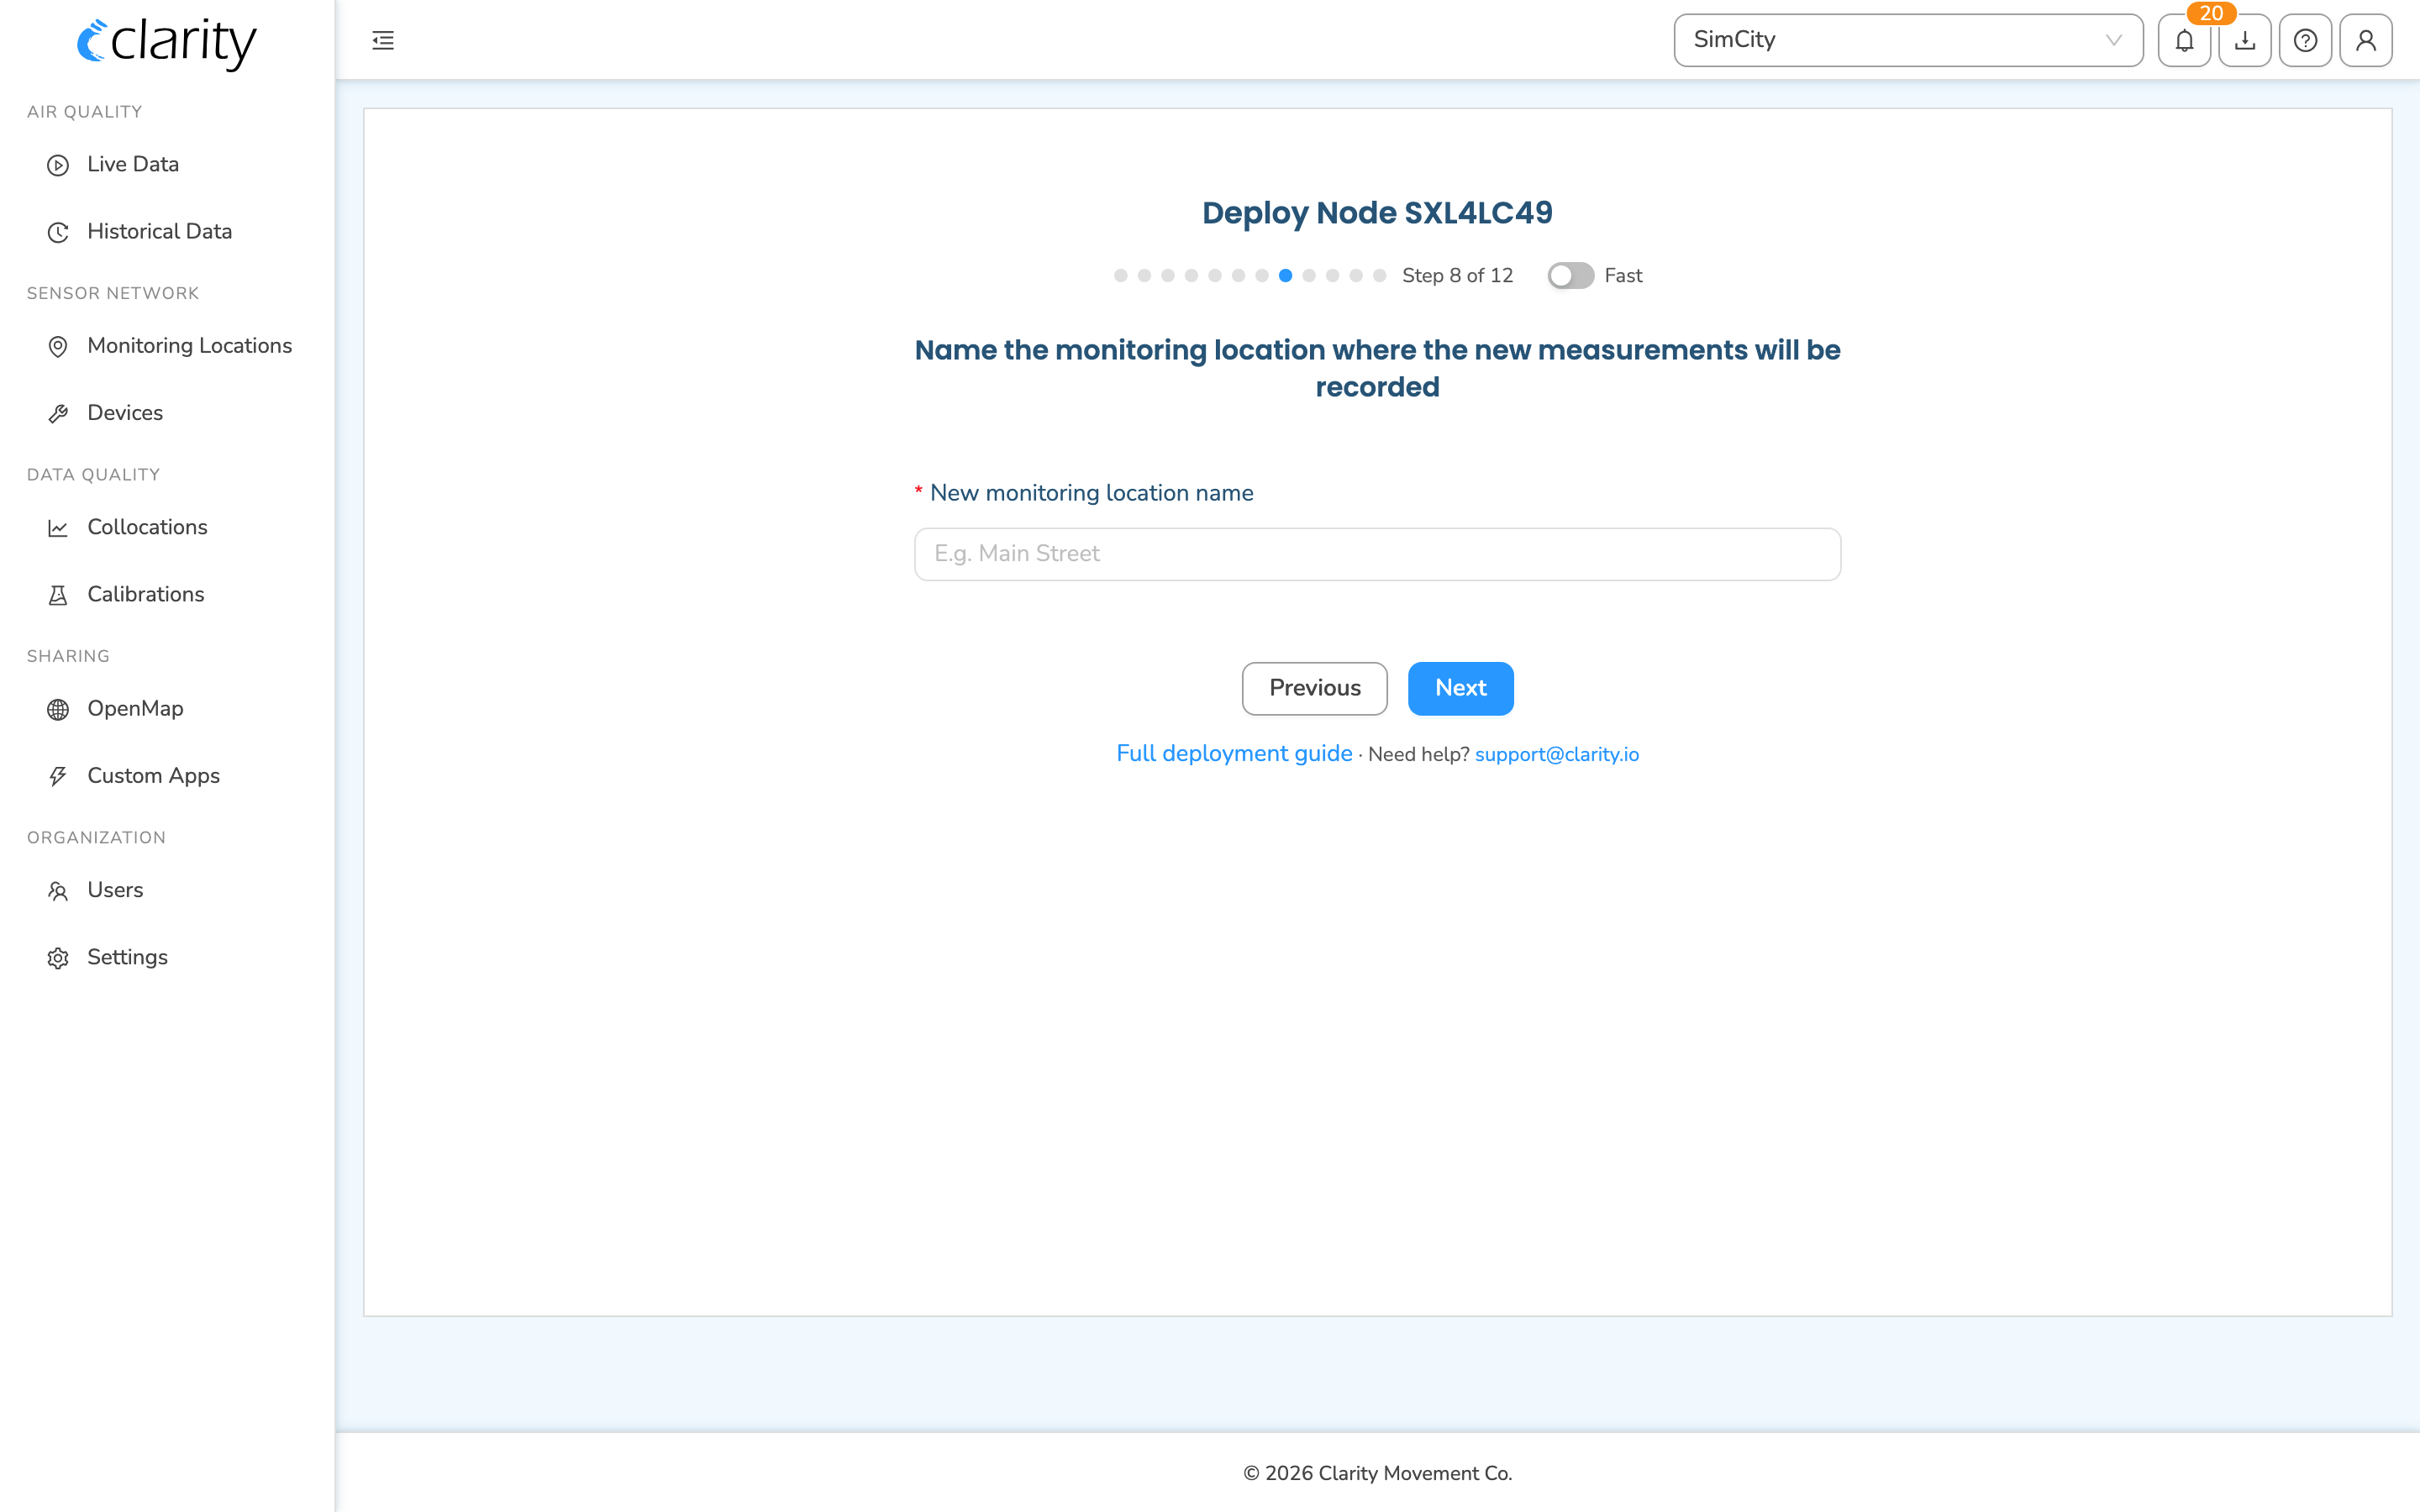
The wizard title reads Deploy Node <id>. It opens with a short pre-deployment guide (you can switch on "fast mode" to skip the guide on future deployments), then walks you through these steps:
- Name the monitoring location — choose a name for the new monitoring location the node will record to. Tip: For field deployments, name it for the site (e.g. "Main Street"). For collocations, use something descriptive like "Collocation at Laney College for A20DDFG4".
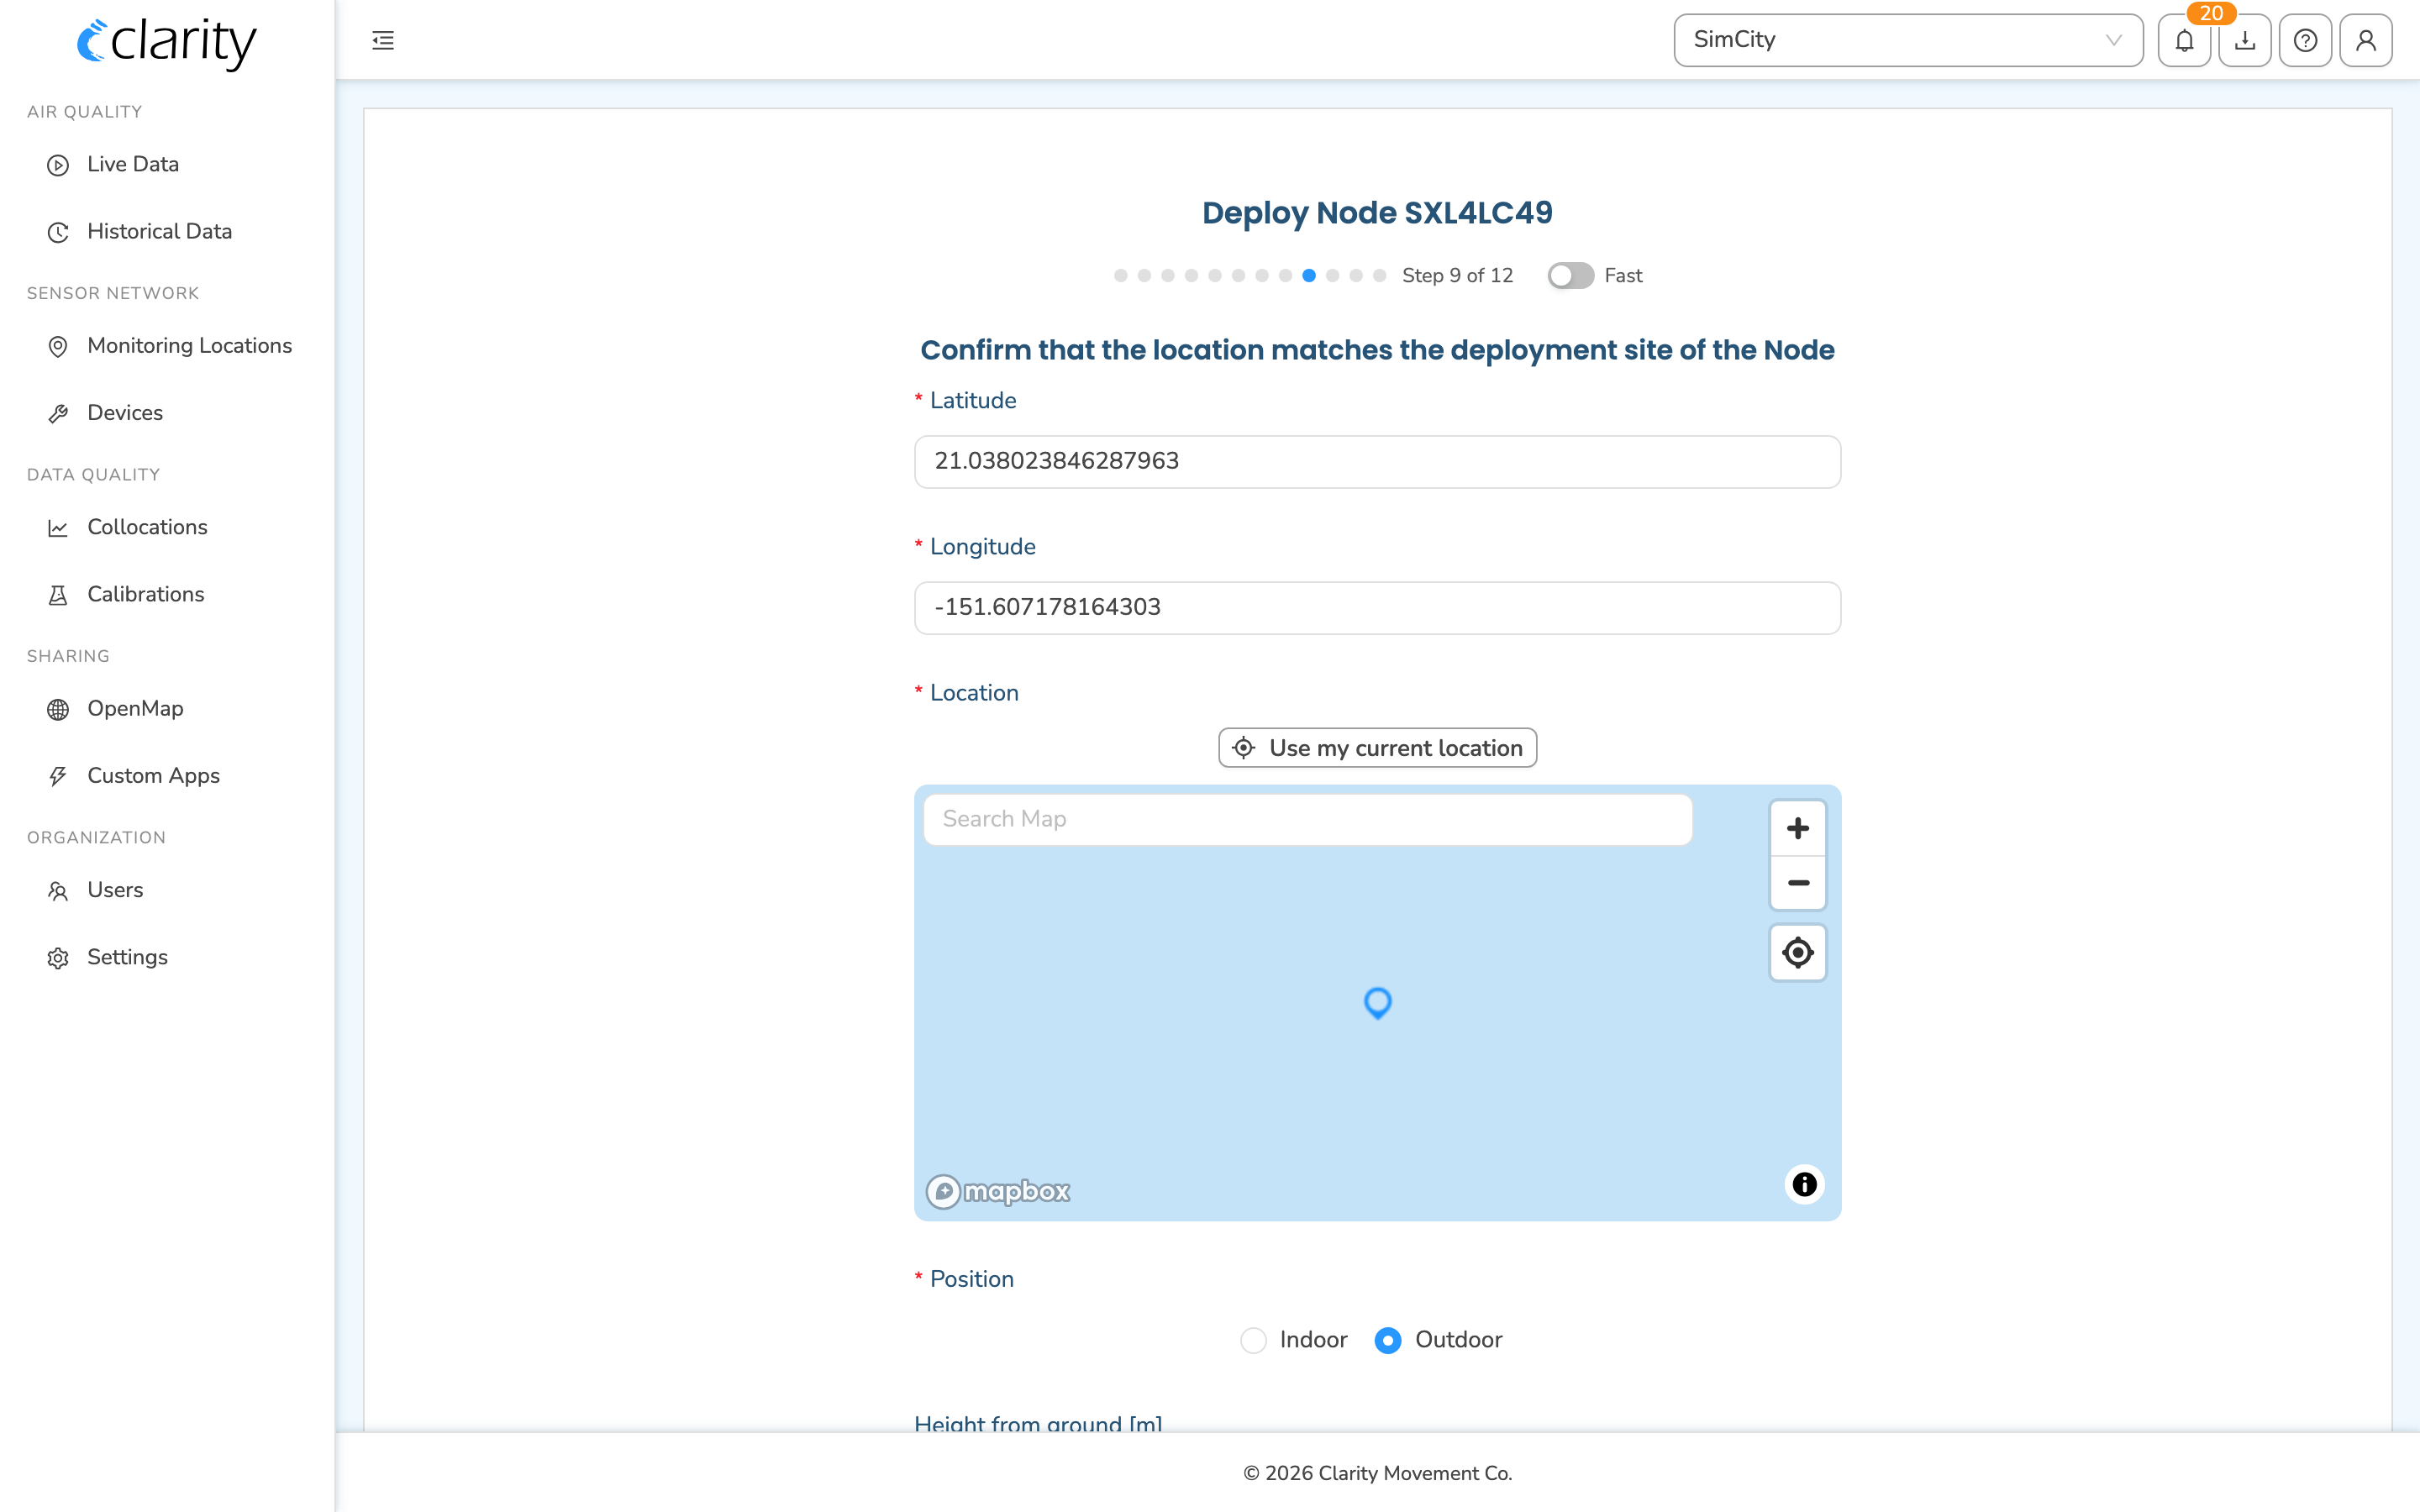
- Confirm the location — set the node's deployment site by latitude/longitude. You can type the coordinates, drag the map pin, or use Use my location. Also set Position (Indoor / Outdoor), and optionally Height from ground and Distance from road.
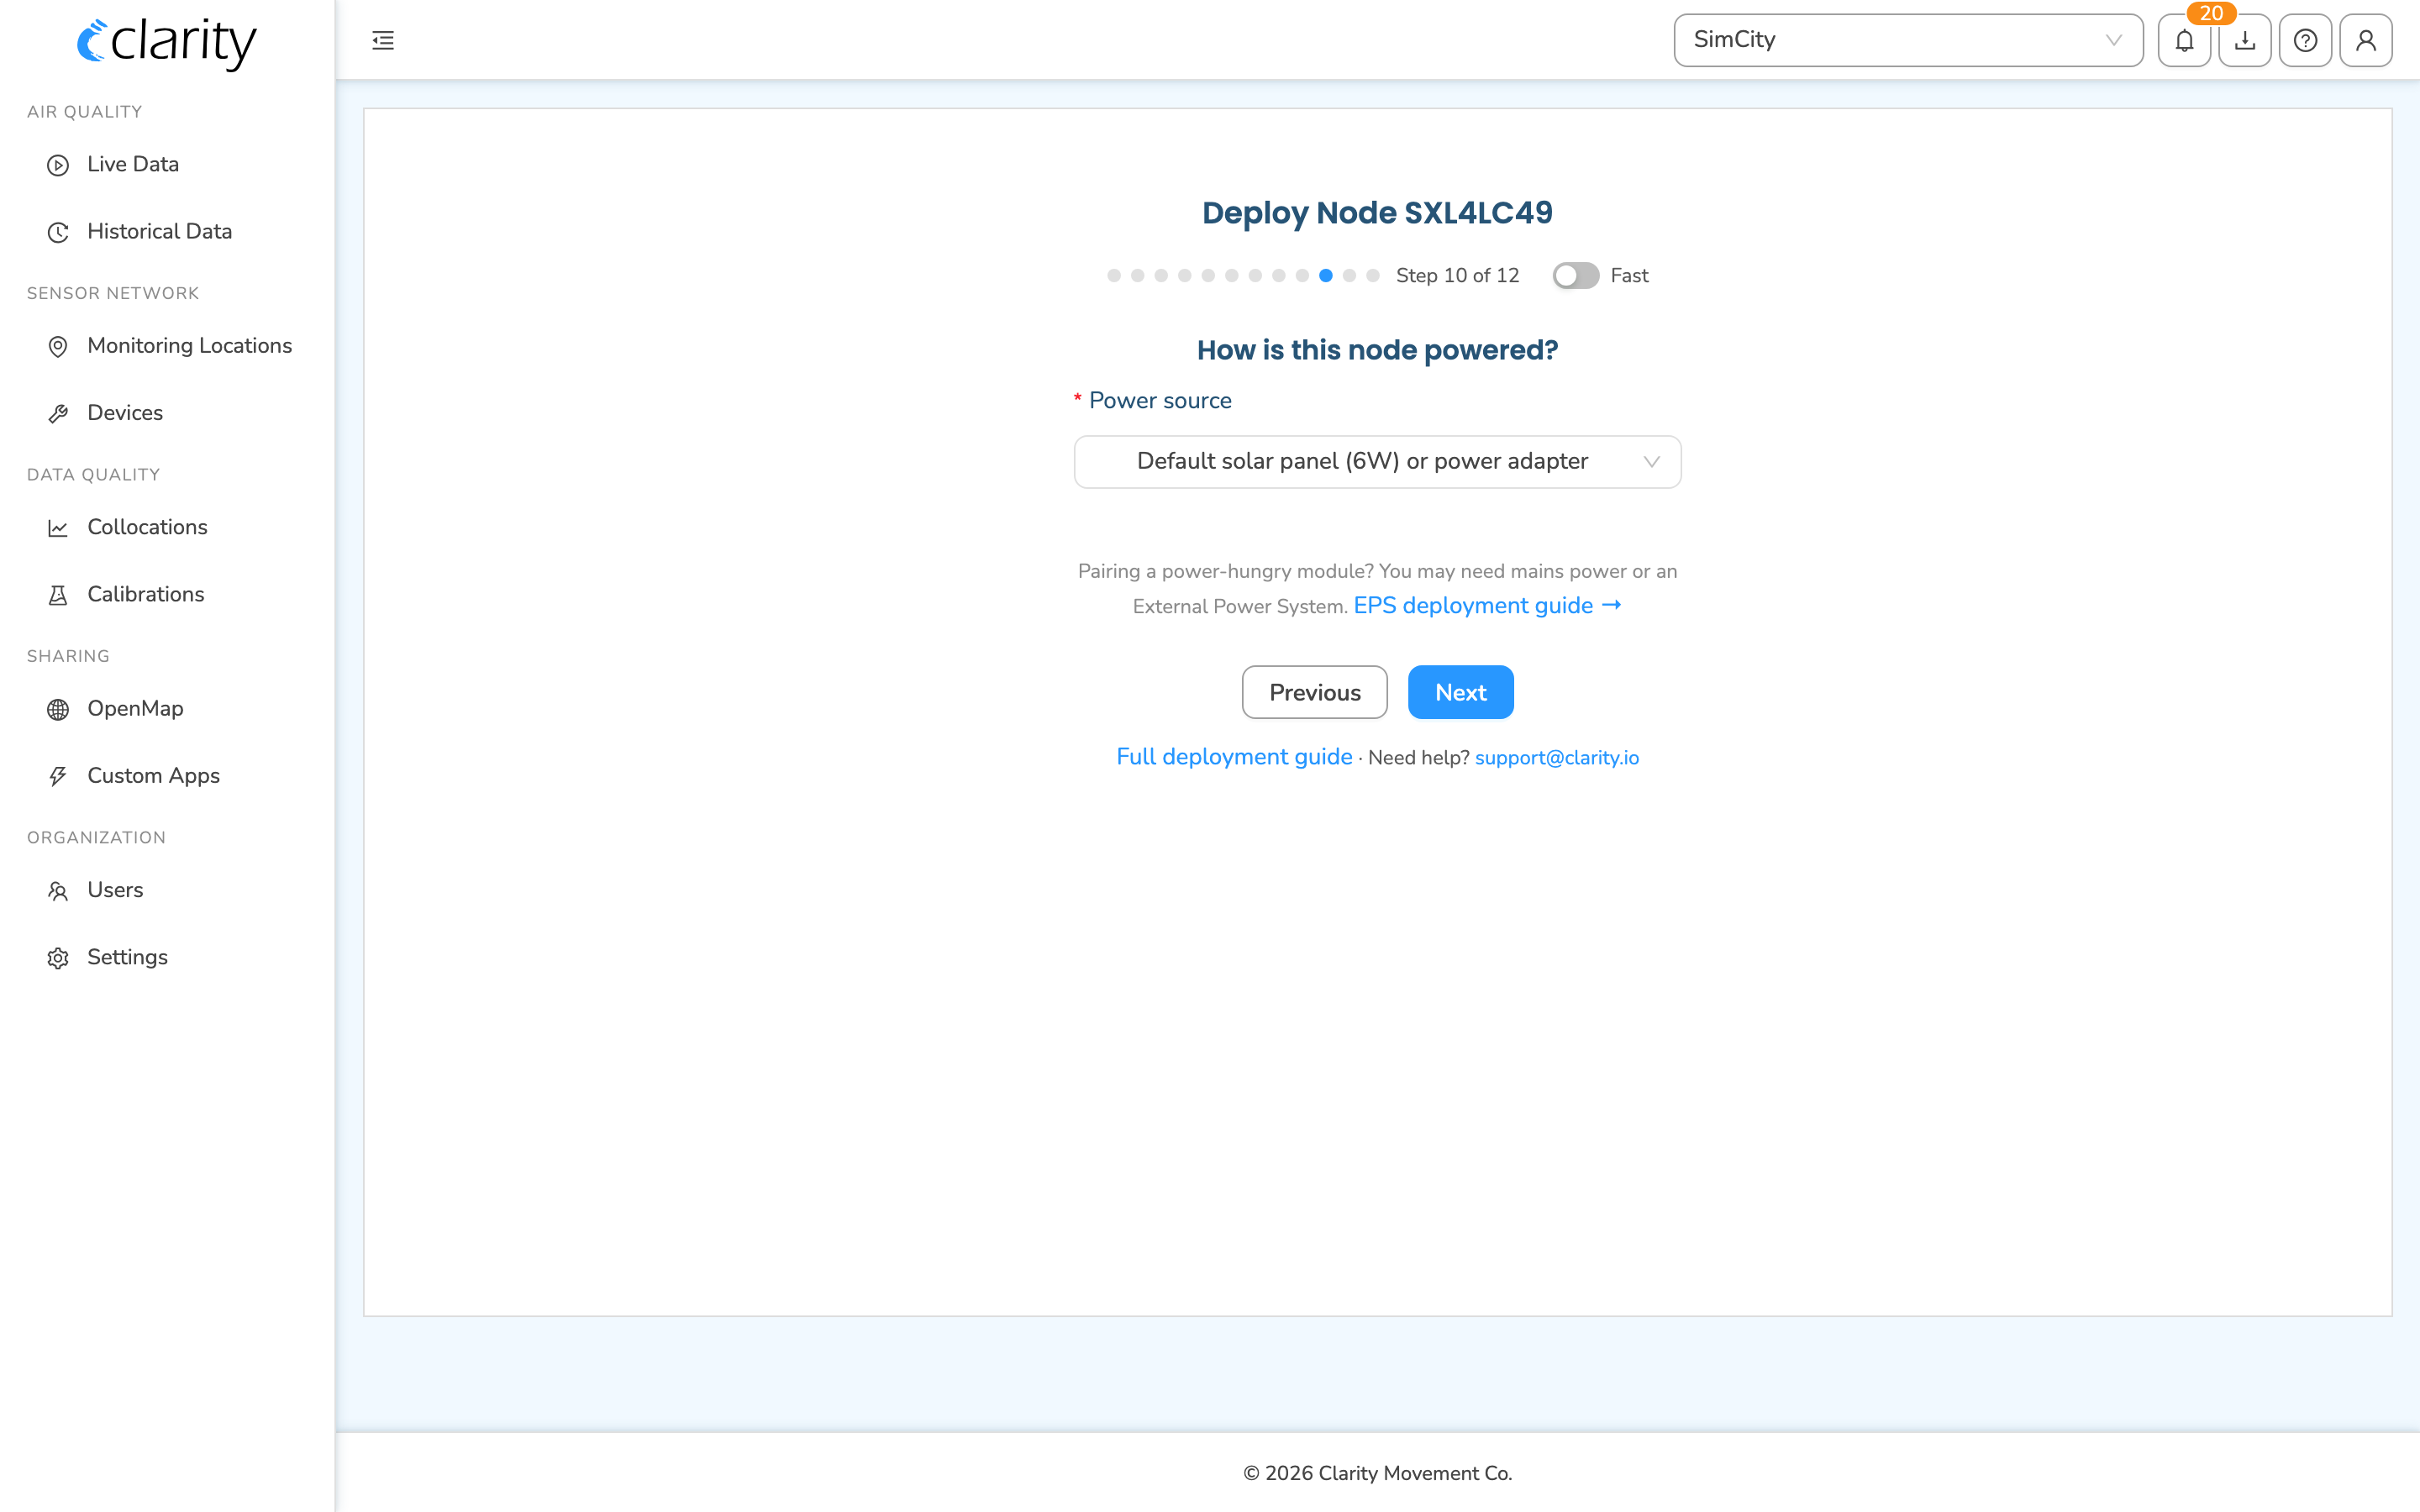
- How is this node powered? — choose the Power source (the default solar panel / power adapter, or an external option). If you pick an external option, enter the Power module ID. A note links to the EPS deployment guide for power-hungry modules.
- Choose a photo — optionally upload a photo of the deployed device to help identify it later.
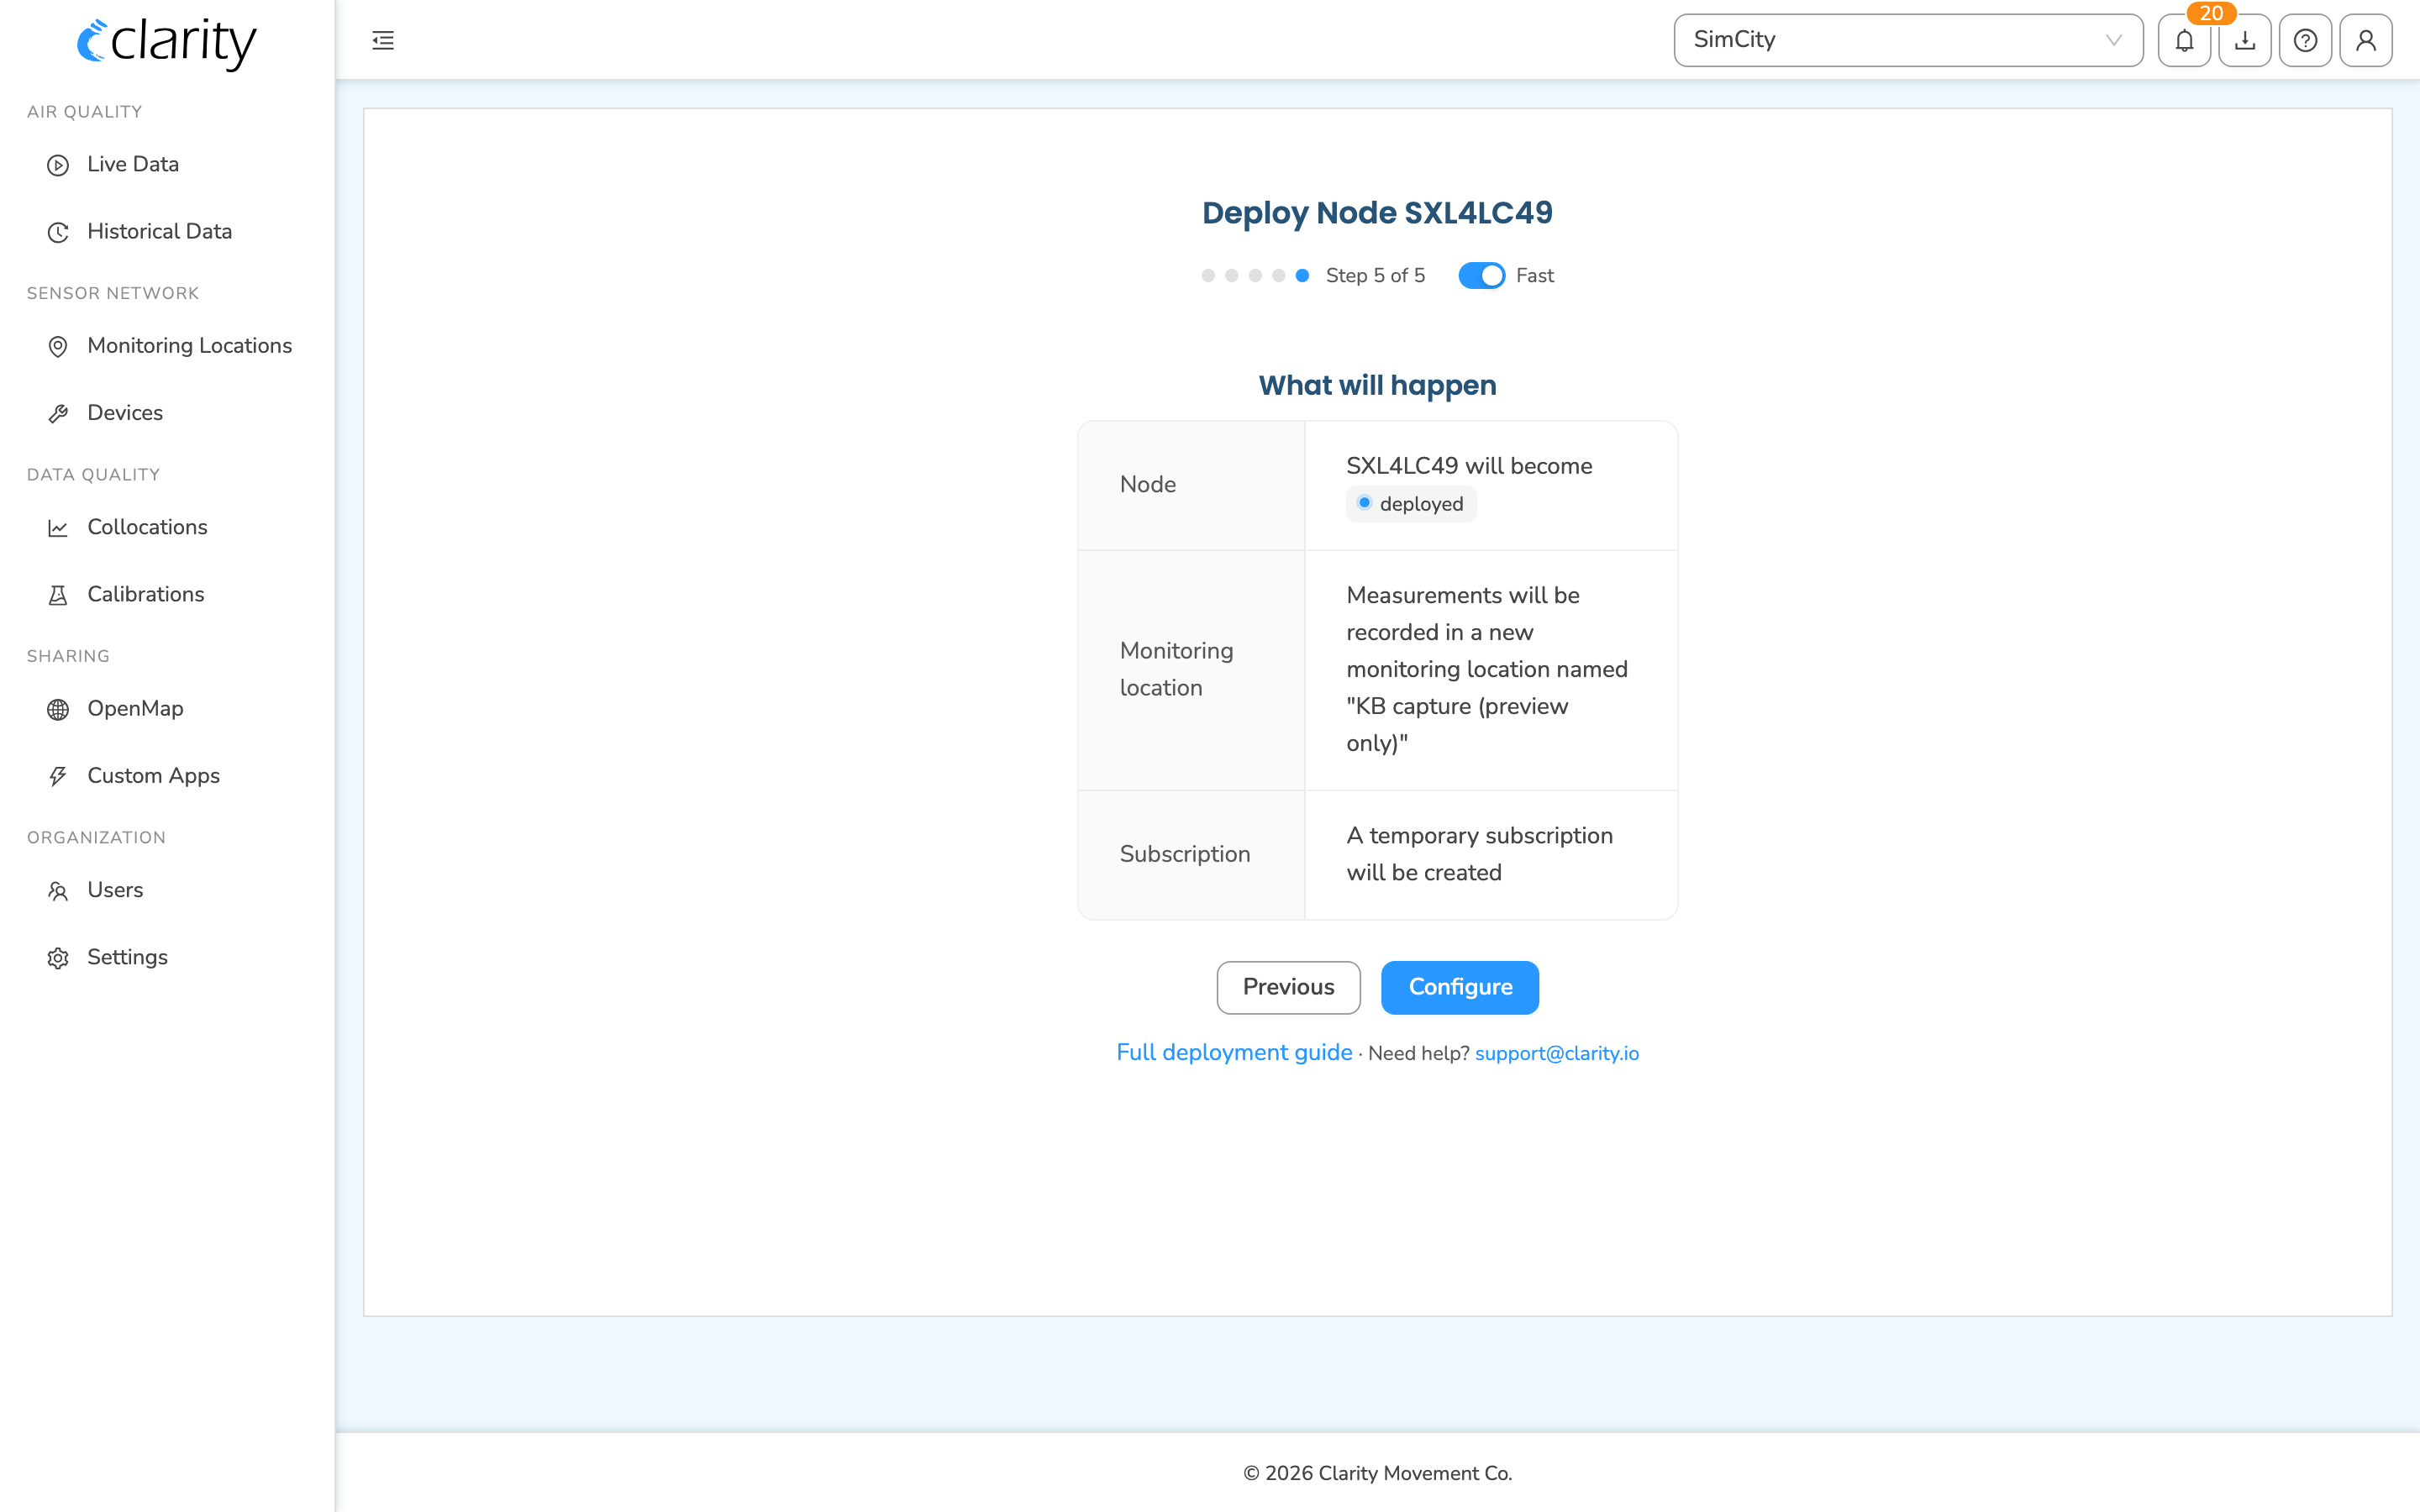
- Review — the wizard shows a "What will happen" summary. Click Configure to deploy.
After you submit, the wizard doesn't just confirm — it shows a live deployment status tracker (Configured → Connecting → Receiving data) so you can watch the node come online, plus a "Pair a module?" card if you want to add a module right away. From there, Go to Monitoring Locations takes you to the new location's card.
If you open the configure flow on a node that's already deployed, the wizard shows an "already deployed" view with the live status tracker instead of the deployment form — there's nothing to configure.
Pairing a module
Modules (Multi-Gas, Black Carbon, etc.) attach to a node to expand what it measures. There are two ways to pair:
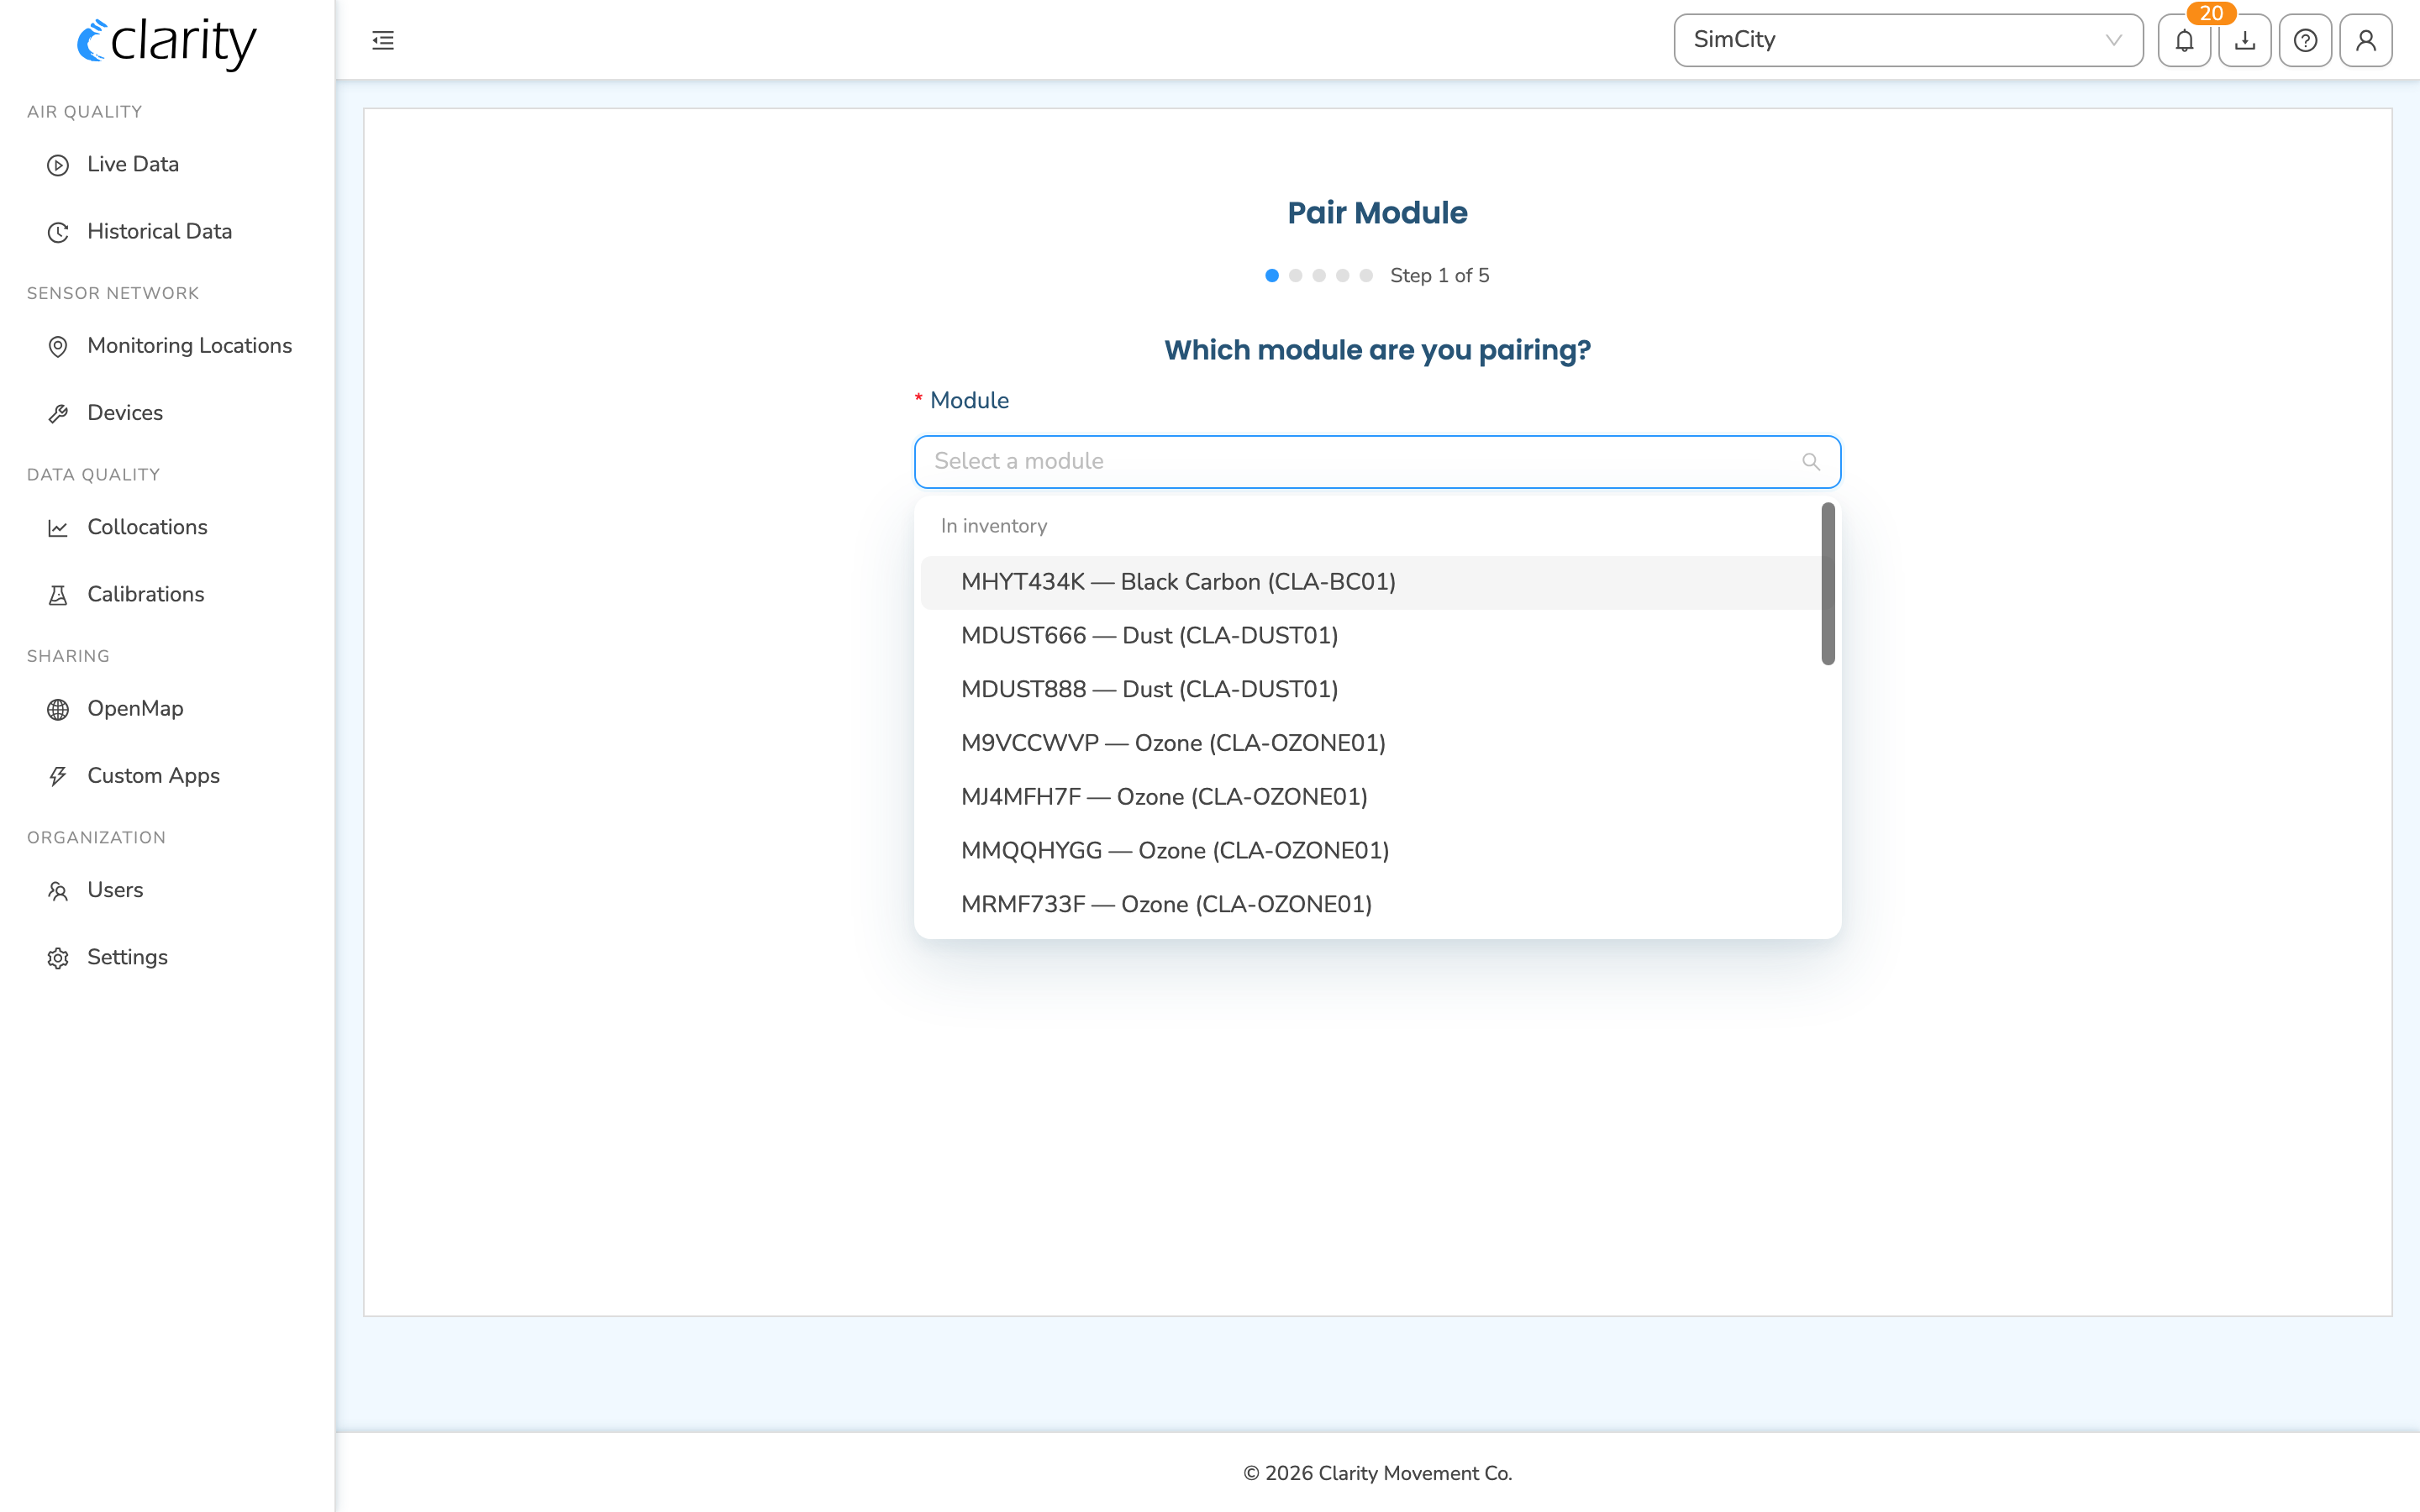
A) The Pair module wizard (best when you have the module in hand or scanned its QR code):
- Open Devices, click Pair module (top-right) — or use the ⋮ → Pair module on a module in the Inventory tab, or scan the module's QR code.
- Which module are you pairing? — pick the module (in-inventory modules are selectable; already-paired ones are listed but disabled).
- Confirm the module — review the module details; a warning shows if it's already paired elsewhere.
- Family guide + checklist — step through the family-specific deployment guide cards and tick the confirmation checklist.
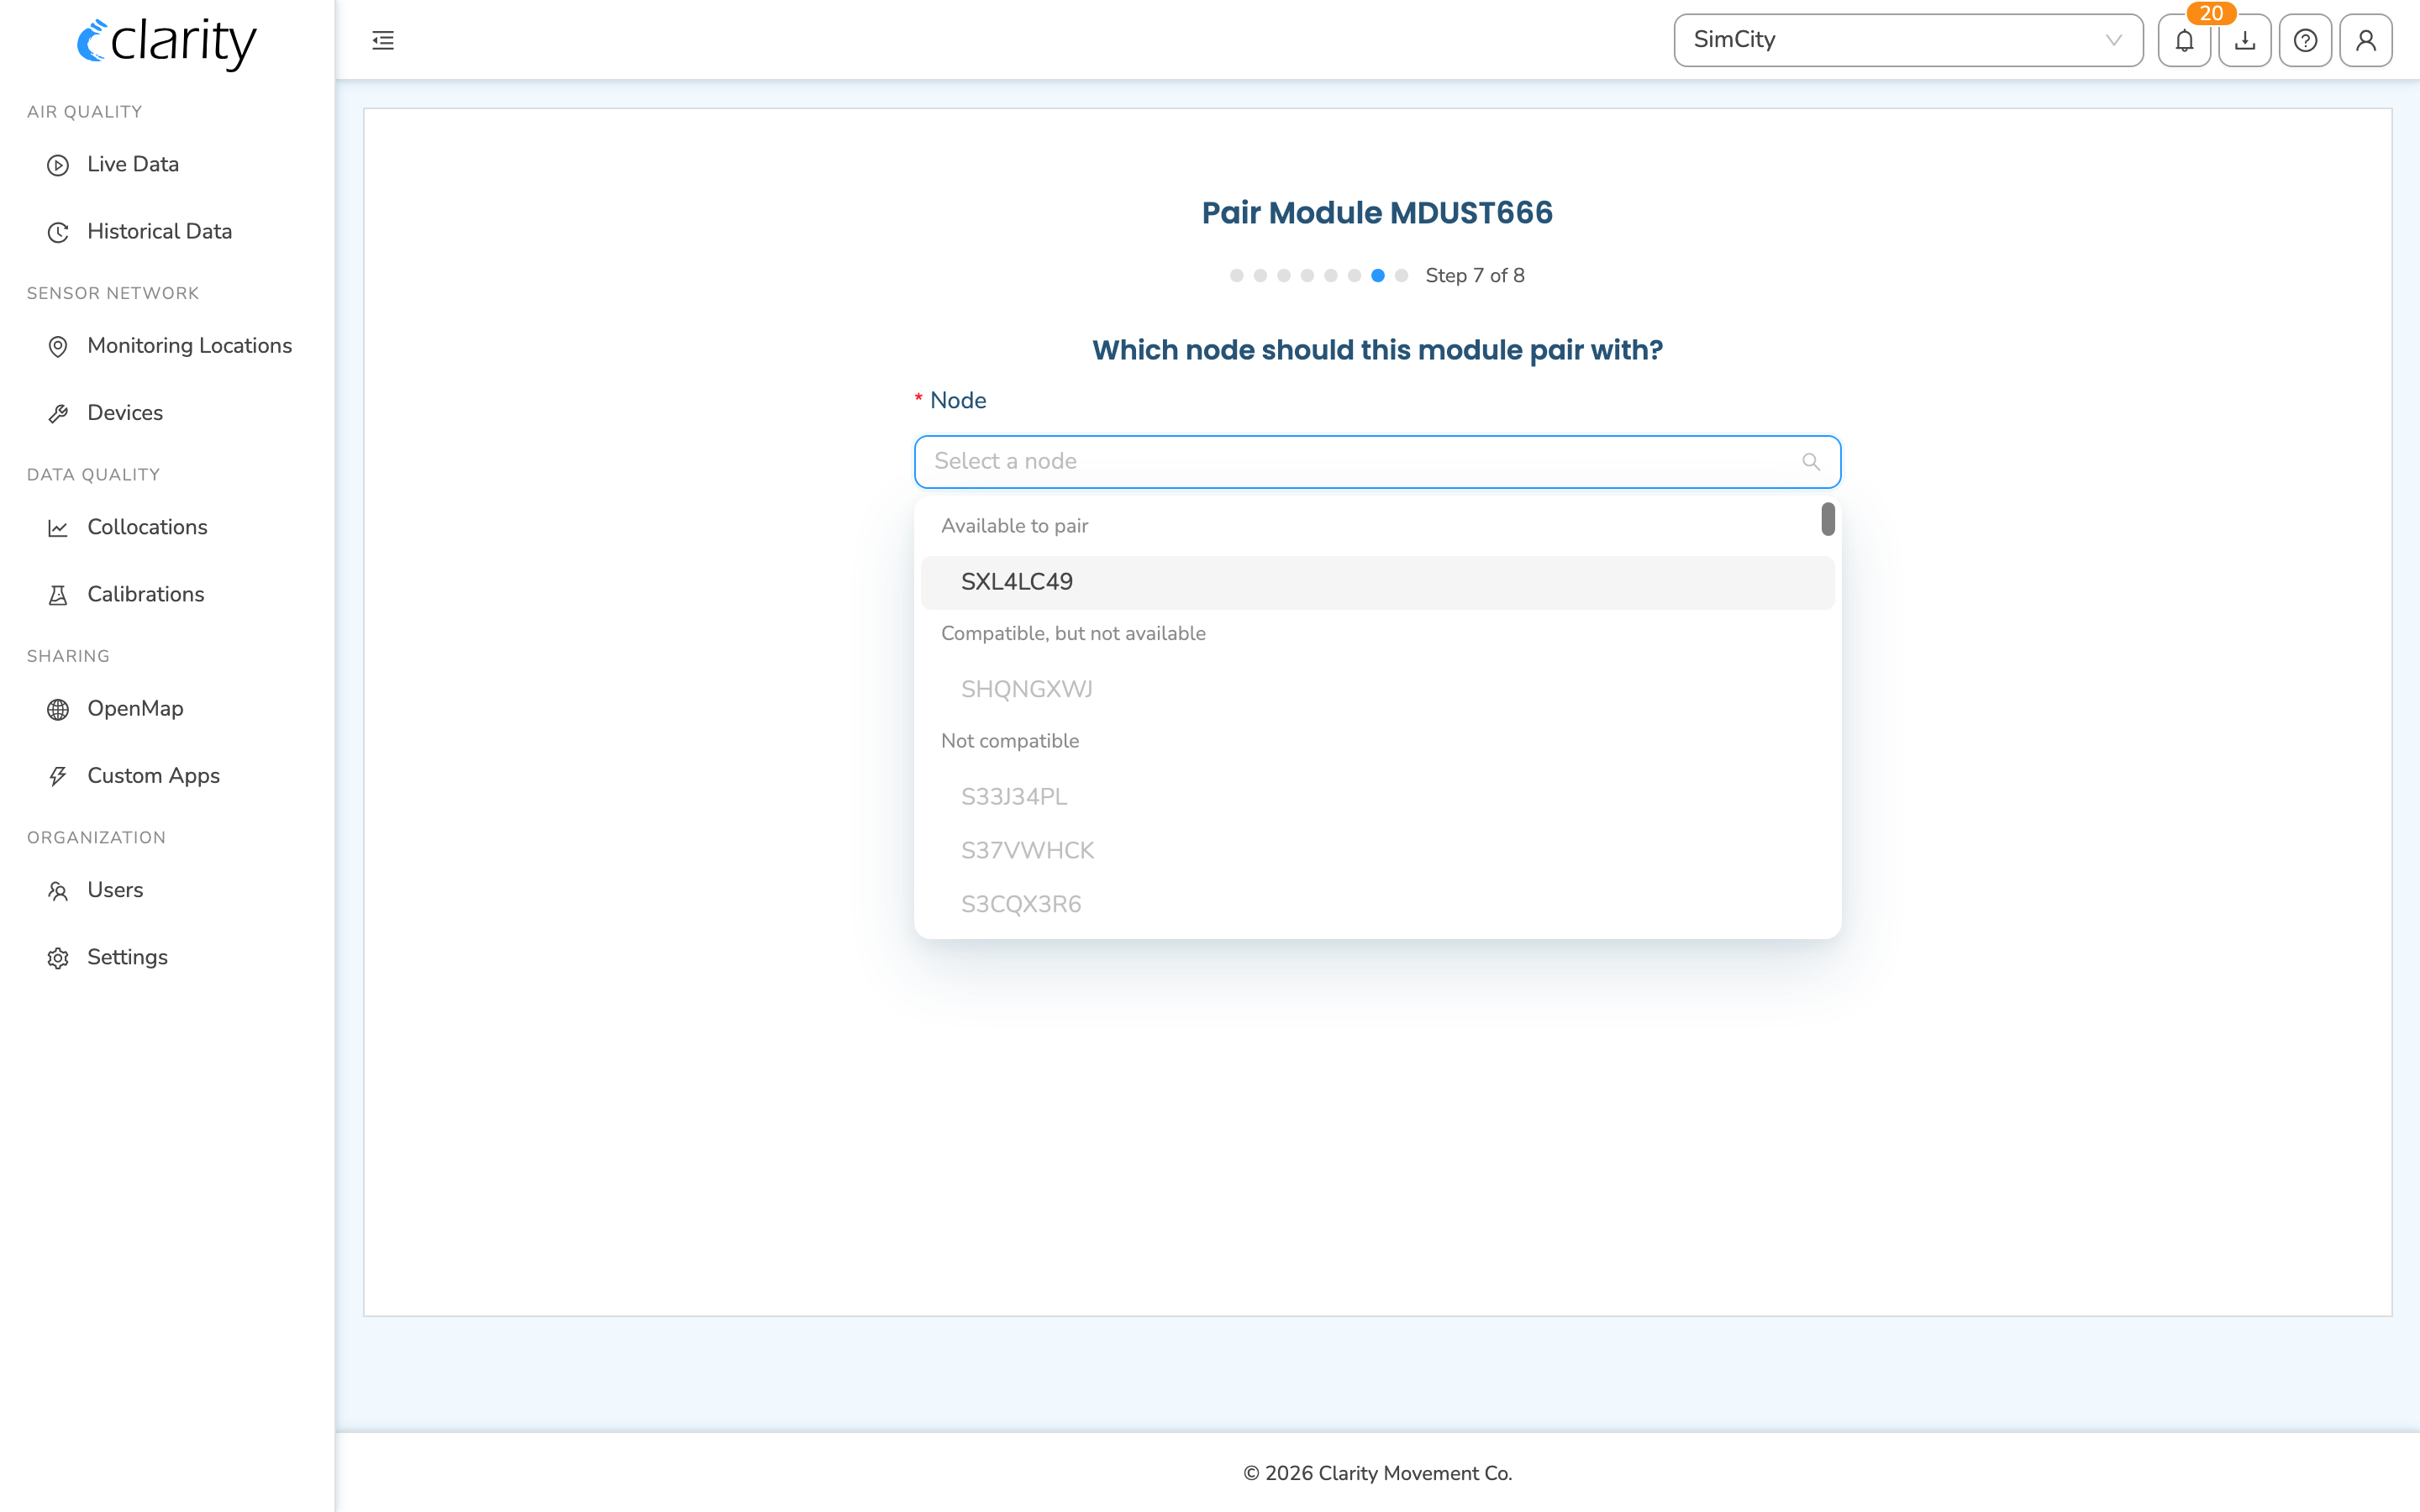
- Which node should this module pair with? — pick a compatible, available node. Nodes that are compatible-but-busy or incompatible are listed but disabled.
- Review and pair — confirm module + node, review any power-compatibility advisory, and click Pair.
On success you get a confirmation with a reminder to listen for the Module-Connection-Success beep at the site, and a link to the node's location.
B) From a location card (best when the node is already deployed): open the node's location on Monitoring Locations, and in the Devices section click Pair module (or Pair / unpair modules if modules are already attached). This opens an in-place Pair modules modal — no separate wizard hop.
Unpairing a module
Unpairing lives in the Pair modules modal. Open the node's location card in Monitoring Locations → Devices section → Pair / unpair modules, then choose Unpair next to the module (you'll get an Unpair module confirmation). You can also unpair from the Compatible nodes modal on the Inventory tab.
Viewing compatible modules / nodes
To see compatible modules or nodes, use the Devices → Inventory devices tab and the row ⋮ menu:
- On a node: Compatible modules — shows the module types that pair with this node and how many you have available.
- On a module: Compatible nodes — shows which nodes this module can pair with.
Lifecycle actions on a location card
Open a node's location card from Monitoring Locations (click the location in the table/map), or from the Devices page via ⋮ → Manage monitoring location. The card is where the node lifecycle actions live.
Replace a node
Use Replace to swap out a node — for a fault or end of life — while keeping the location and its history running on the same monitoring location.
- On the location card, in the Devices section, click Replace next to the node row.
- In the Replace node in <location> modal, pick a Replacement node from inventory.
- Review the "What will happen" summary — the replaced node moves to inventory; the replacement is configured at the same location and coordinates.
- Click Confirm.
Edit the node's deployment
Editing is split into focused, in-place edits on the location card:
- Edit name, group, and tags — click the pencil next to the location name in the card header.
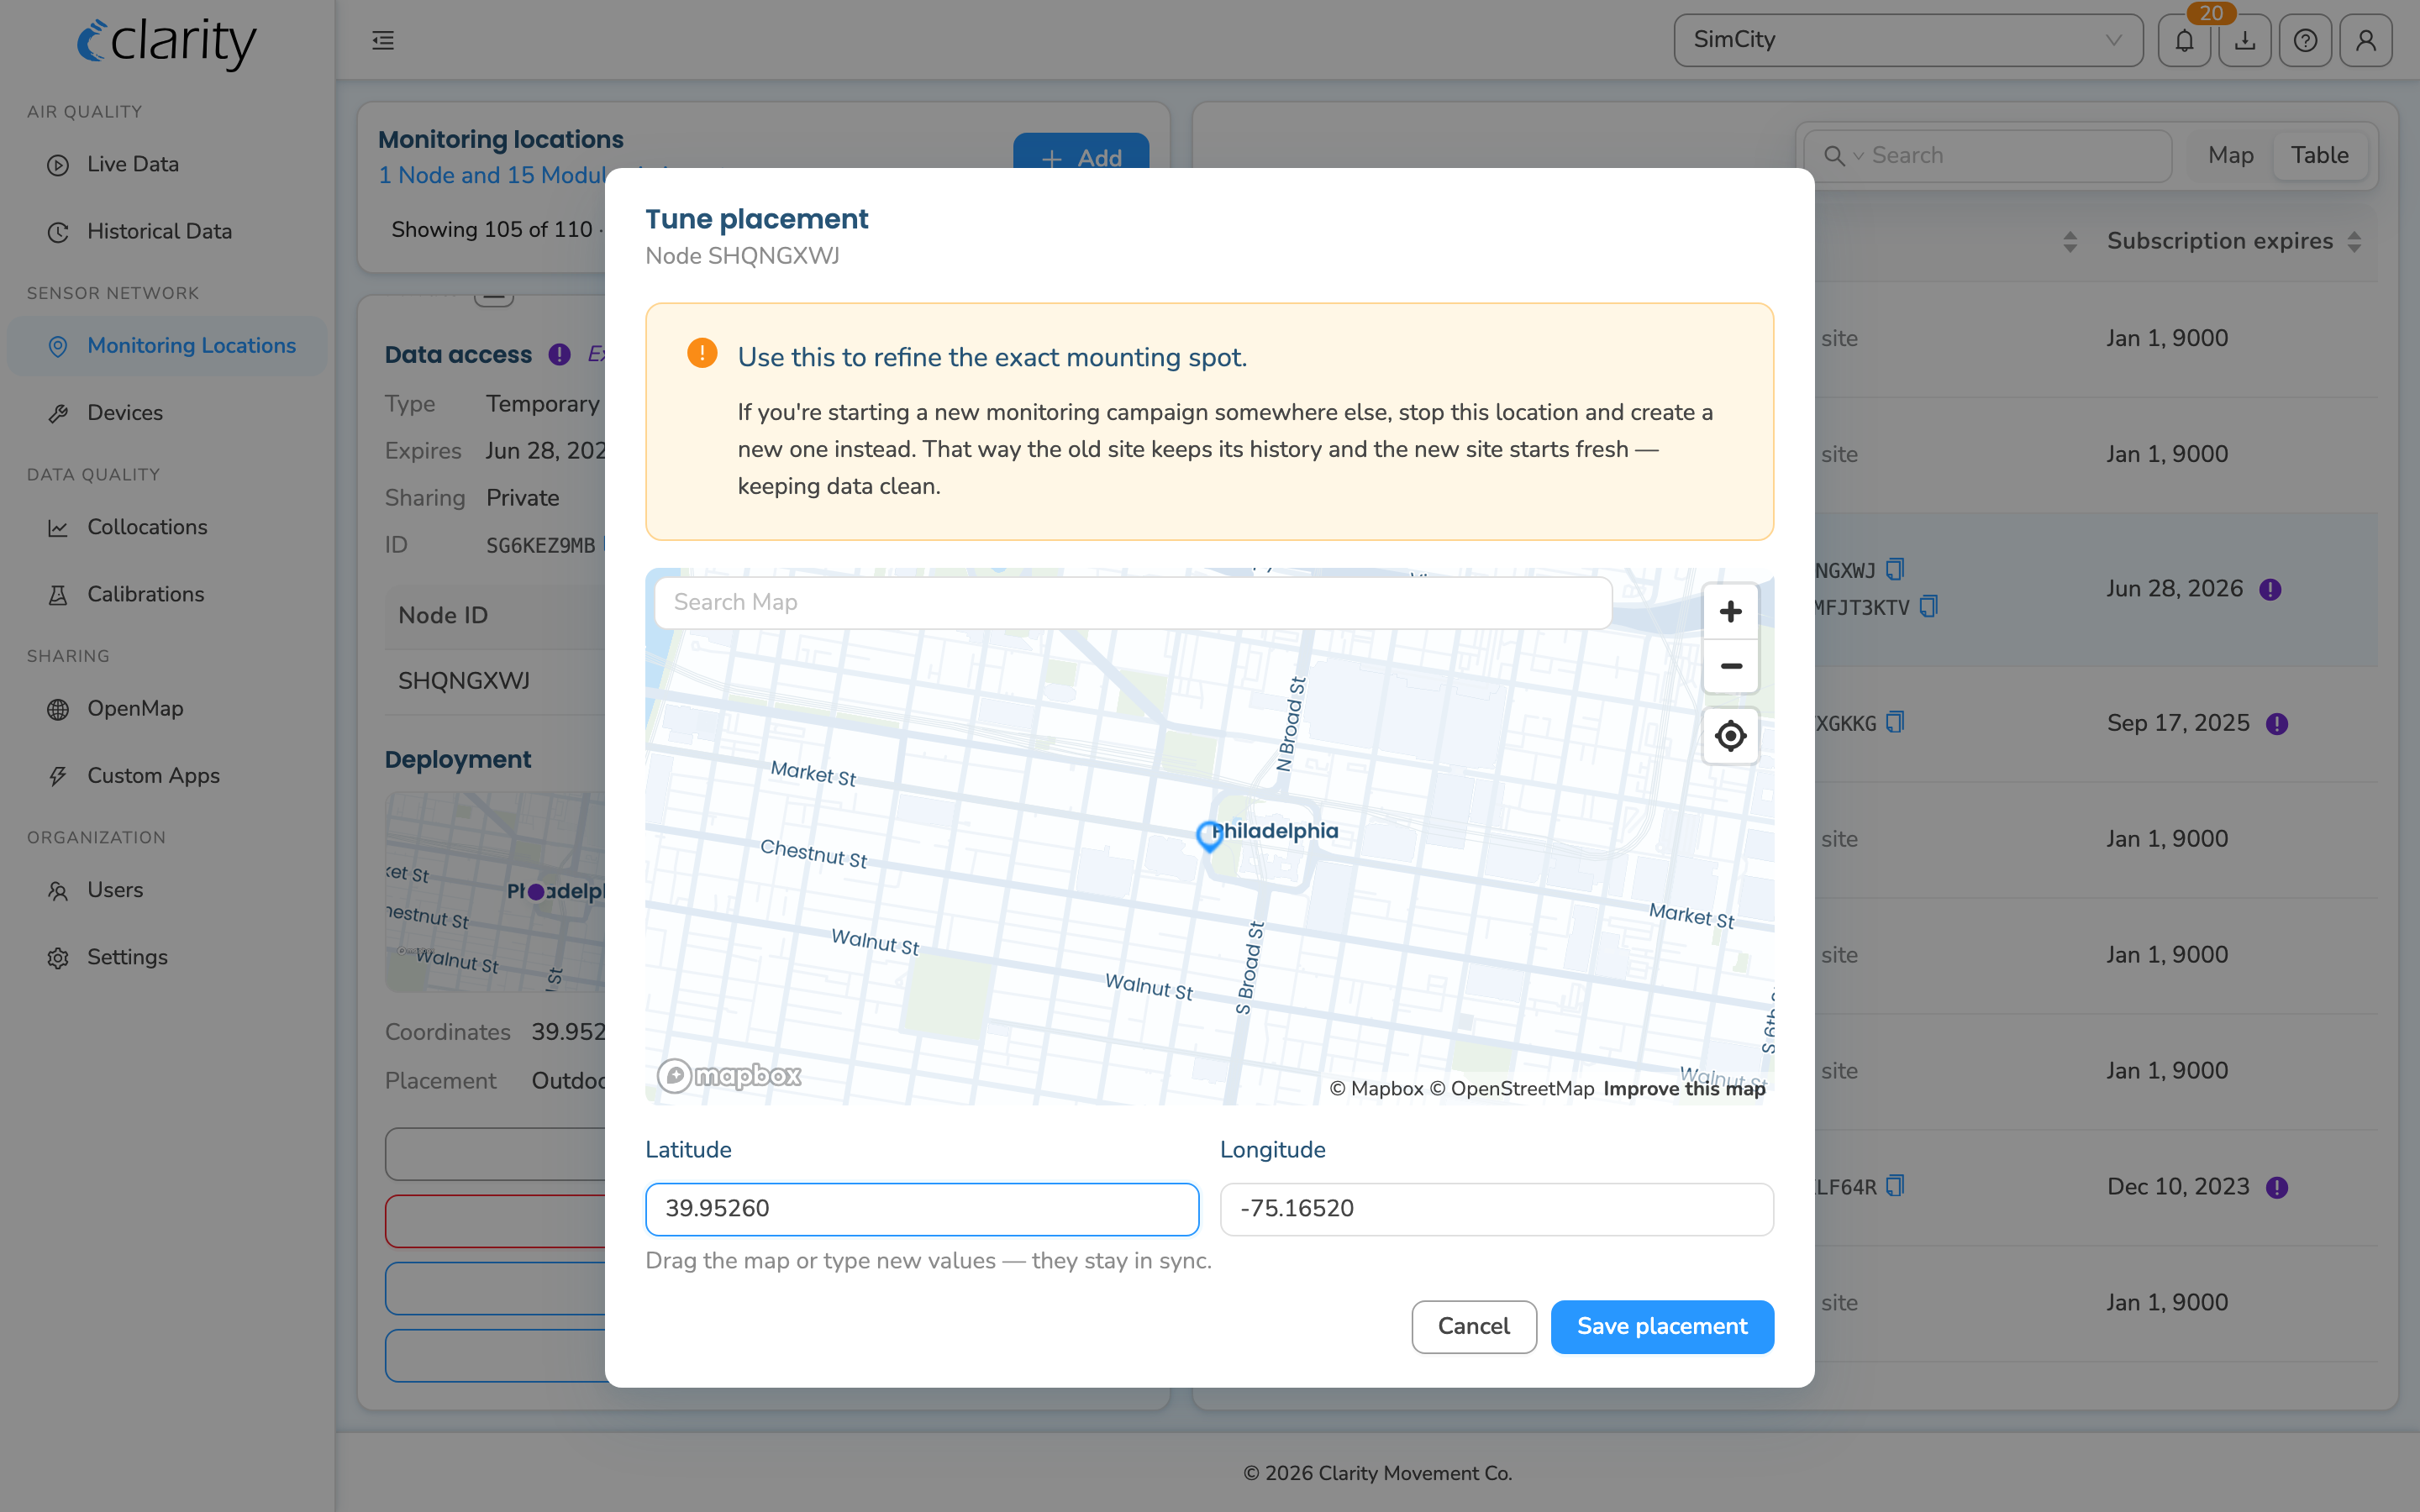
- Tune placement — refine the exact lat/lon mounting spot. Open it from the Deployment section ("Tune placement", subtitle Node <id>).
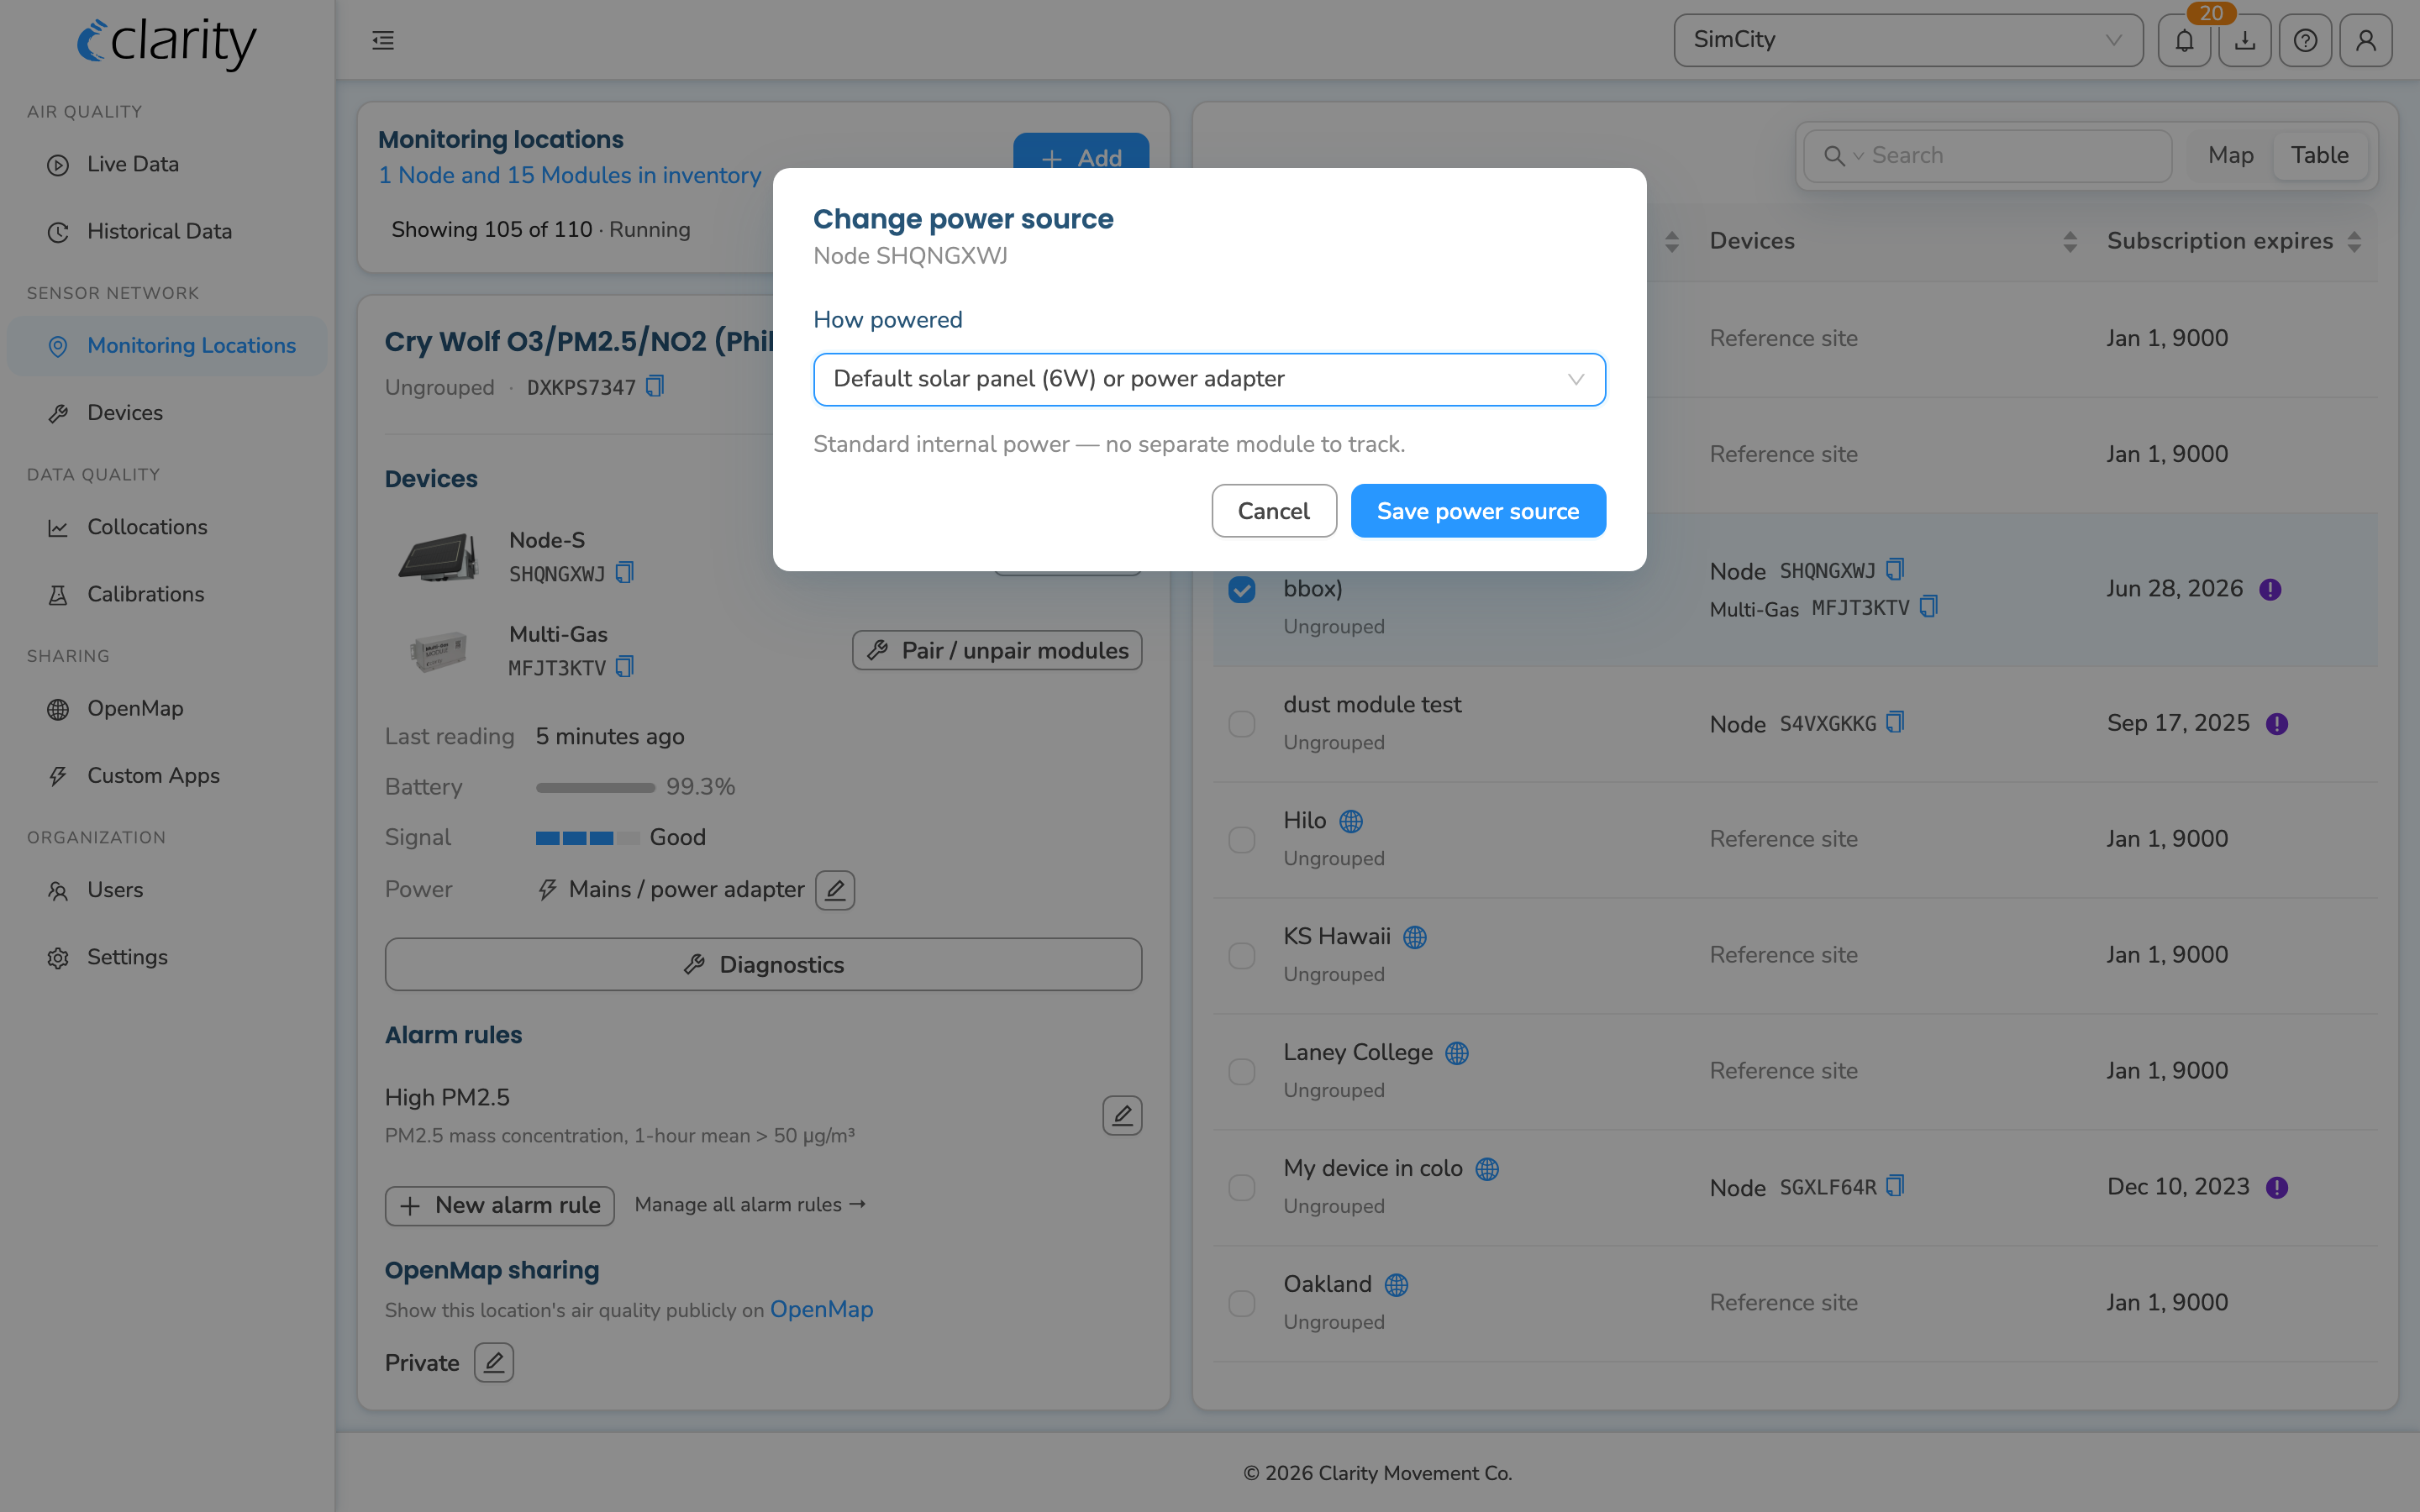
- Change power source — update how the node is powered. Click the pencil next to the Power row in the Devices section. The card flags a mismatch if the node reports a different supply than what's configured (e.g. configured as EPS but running on mains).
Stop a monitoring location (return a node to inventory)
Stopping is useful when you want to retire a location or move a node to a new site (so the new site streams to its own fresh location).
- On the location card, click Stop monitoring location (the red button in the bottom actions).
- The Stop recording data modal shows a "What will happen" summary:
- The node moves to inventory.
- The monitoring location becomes stopped and preserves its historical data.
- Any attached subscriptions are detached, and any paired modules are unpaired.
- Expand Good to know for tips (historical data is preserved, you can resume later with any inventory node, etc.).
- Click Confirm.
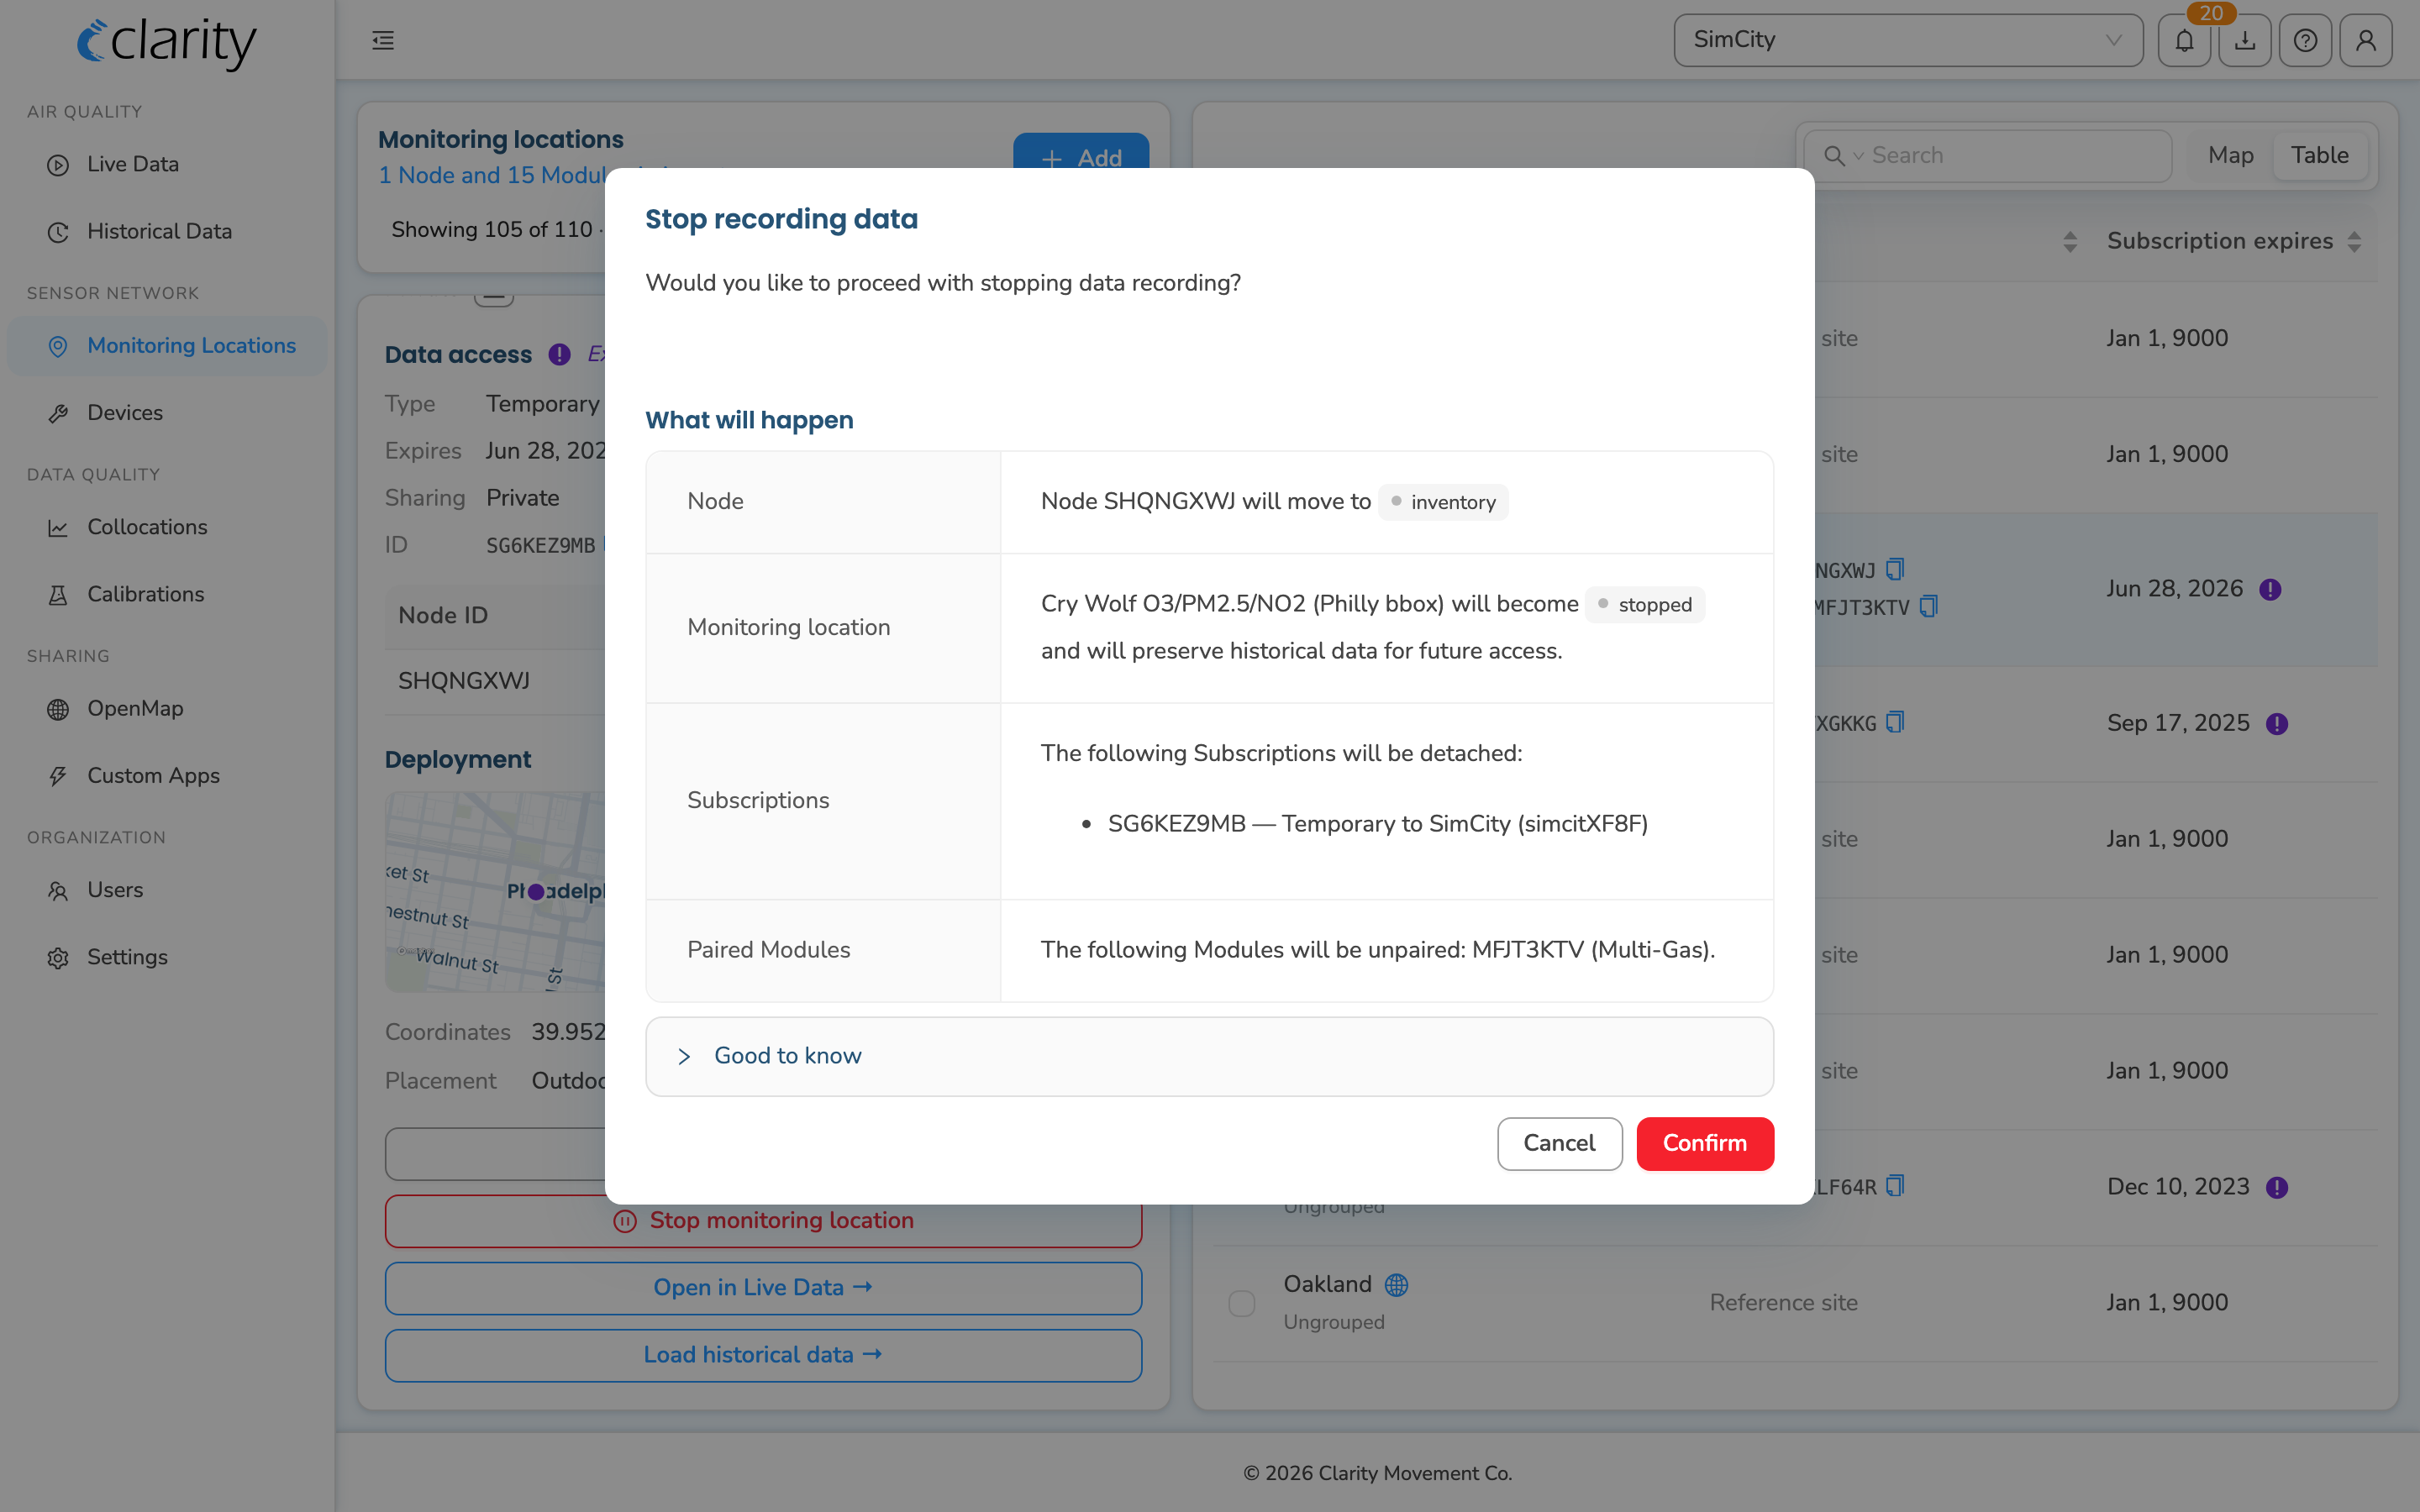
Note: The button on the location card is Stop monitoring location; the confirmation modal it opens is titled Stop recording data.
Resume a stopped location
A stopped location keeps its history and can be brought back online. Filter to Stopped on Monitoring Locations, open the stopped location, and in its Devices section choose Attach node from inventory (this opens the Resume monitoring location modal). You can resume with any node from inventory — it doesn't have to be the original.
Node status and diagnostics
For detailed health information, open the Diagnostics drawer. It's available from:
- A deployed device row on the Devices page (⋮ → Diagnostics, or the wrench shortcut on unhealthy rows).
- A location card on Monitoring Locations (the Diagnostics button in the Devices section).
The drawer shows the node's activity histogram, per-sensor and per-module operational status, and alarms — the deep per-node view.
Downloading data
To export a location's measurements, open its card on Monitoring Locations and click Download data.
What's next
- Explore the device Diagnostics view.
- Name, group and tag your monitoring locations.
- Swap a Node while keeping the same datasource.
- Subscribe to device alarms on Dashboard.
Was this article helpful?
Yes, thanks! / Not really
Still need a hand? Email us at support@clarity.io or create a support ticket, and our team will get back to you.