How do I customize CSV file columns when downloading measurements?
When you download a report, you don't have to take the default columns — you can choose exactly which metrics and QC columns to include. This is especially handy when you're using Add-on Modules. This article shows you where those settings live.
So you know: Customizing columns happens inside the report dialog, so start by requesting a report.
1. Open the advanced settings
In the report customization dialog, open the advanced settings.
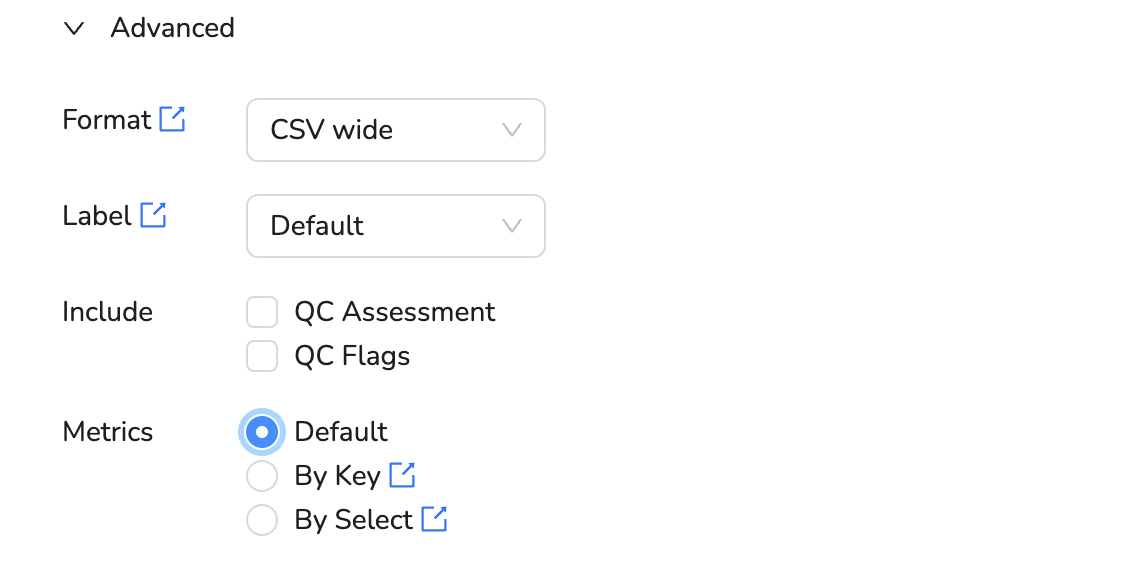
2. Choose whether to include QC columns
For each metric, decide whether to include the QC-related columns — QC assessment and QC flag. These are useful for filtering out invalid data during analysis.
3. Choose which metrics to include
You can pick which monitored parameters appear in the file — important to customize when you're using Add-on Modules. There are two ways:
- By key — a UI where you pick metrics one at a time, split into "recent" (measured by your network in the last 48 hours) and "other."
- By select — type a filter string, following the API documentation.
You're done! Your report will now include exactly the columns you chose.
What's next
Was this article helpful?
Yes, thanks! / Not really
Still need a hand? Email us at support@clarity.io or create a support ticket, and our team will get back to you.