Download your air quality data
Need a CSV (or Parquet) file of your measurements for a spreadsheet, a report, or your own analysis pipeline? Clarity lets you request a custom data export of any monitoring locations or nodes you have access to. The export is prepared in the background, and when it's ready you download the file from the download button in the top bar.
This article walks through requesting an export, tracking it, and downloading the file — plus a reference for every export option.
Note: Exports are not generated from real-time data. The latest reading in an export is typically 15–30 minutes behind the current time.
Where exports live
The download center is the small download icon in the top-right toolbar (next to the notifications bell). It's your personal "mailbox" — it shows your in-flight and recently-ready exports with a one-click Download, and a badge that counts exports still preparing (blue) or freshly ready (green). To see every export your organization has requested, use View and request downloads at the bottom of the popover.
You can kick off a new export from several places, and they all open the same Custom data export dialog. Pick whichever fits where you already are:
| Start from | How |
|---|---|
| Top-right download center | View and request downloads, then New export |
| Monitoring Locations | Select one or more locations, then Download data in the left panel |
| Historical Data | Download button → Custom data export |
Request an export from the download center
This is the most direct route when you just want a file and don't need to browse locations first.
-
Click the download icon in the top-right toolbar, then click View and request downloads at the bottom of the popover.
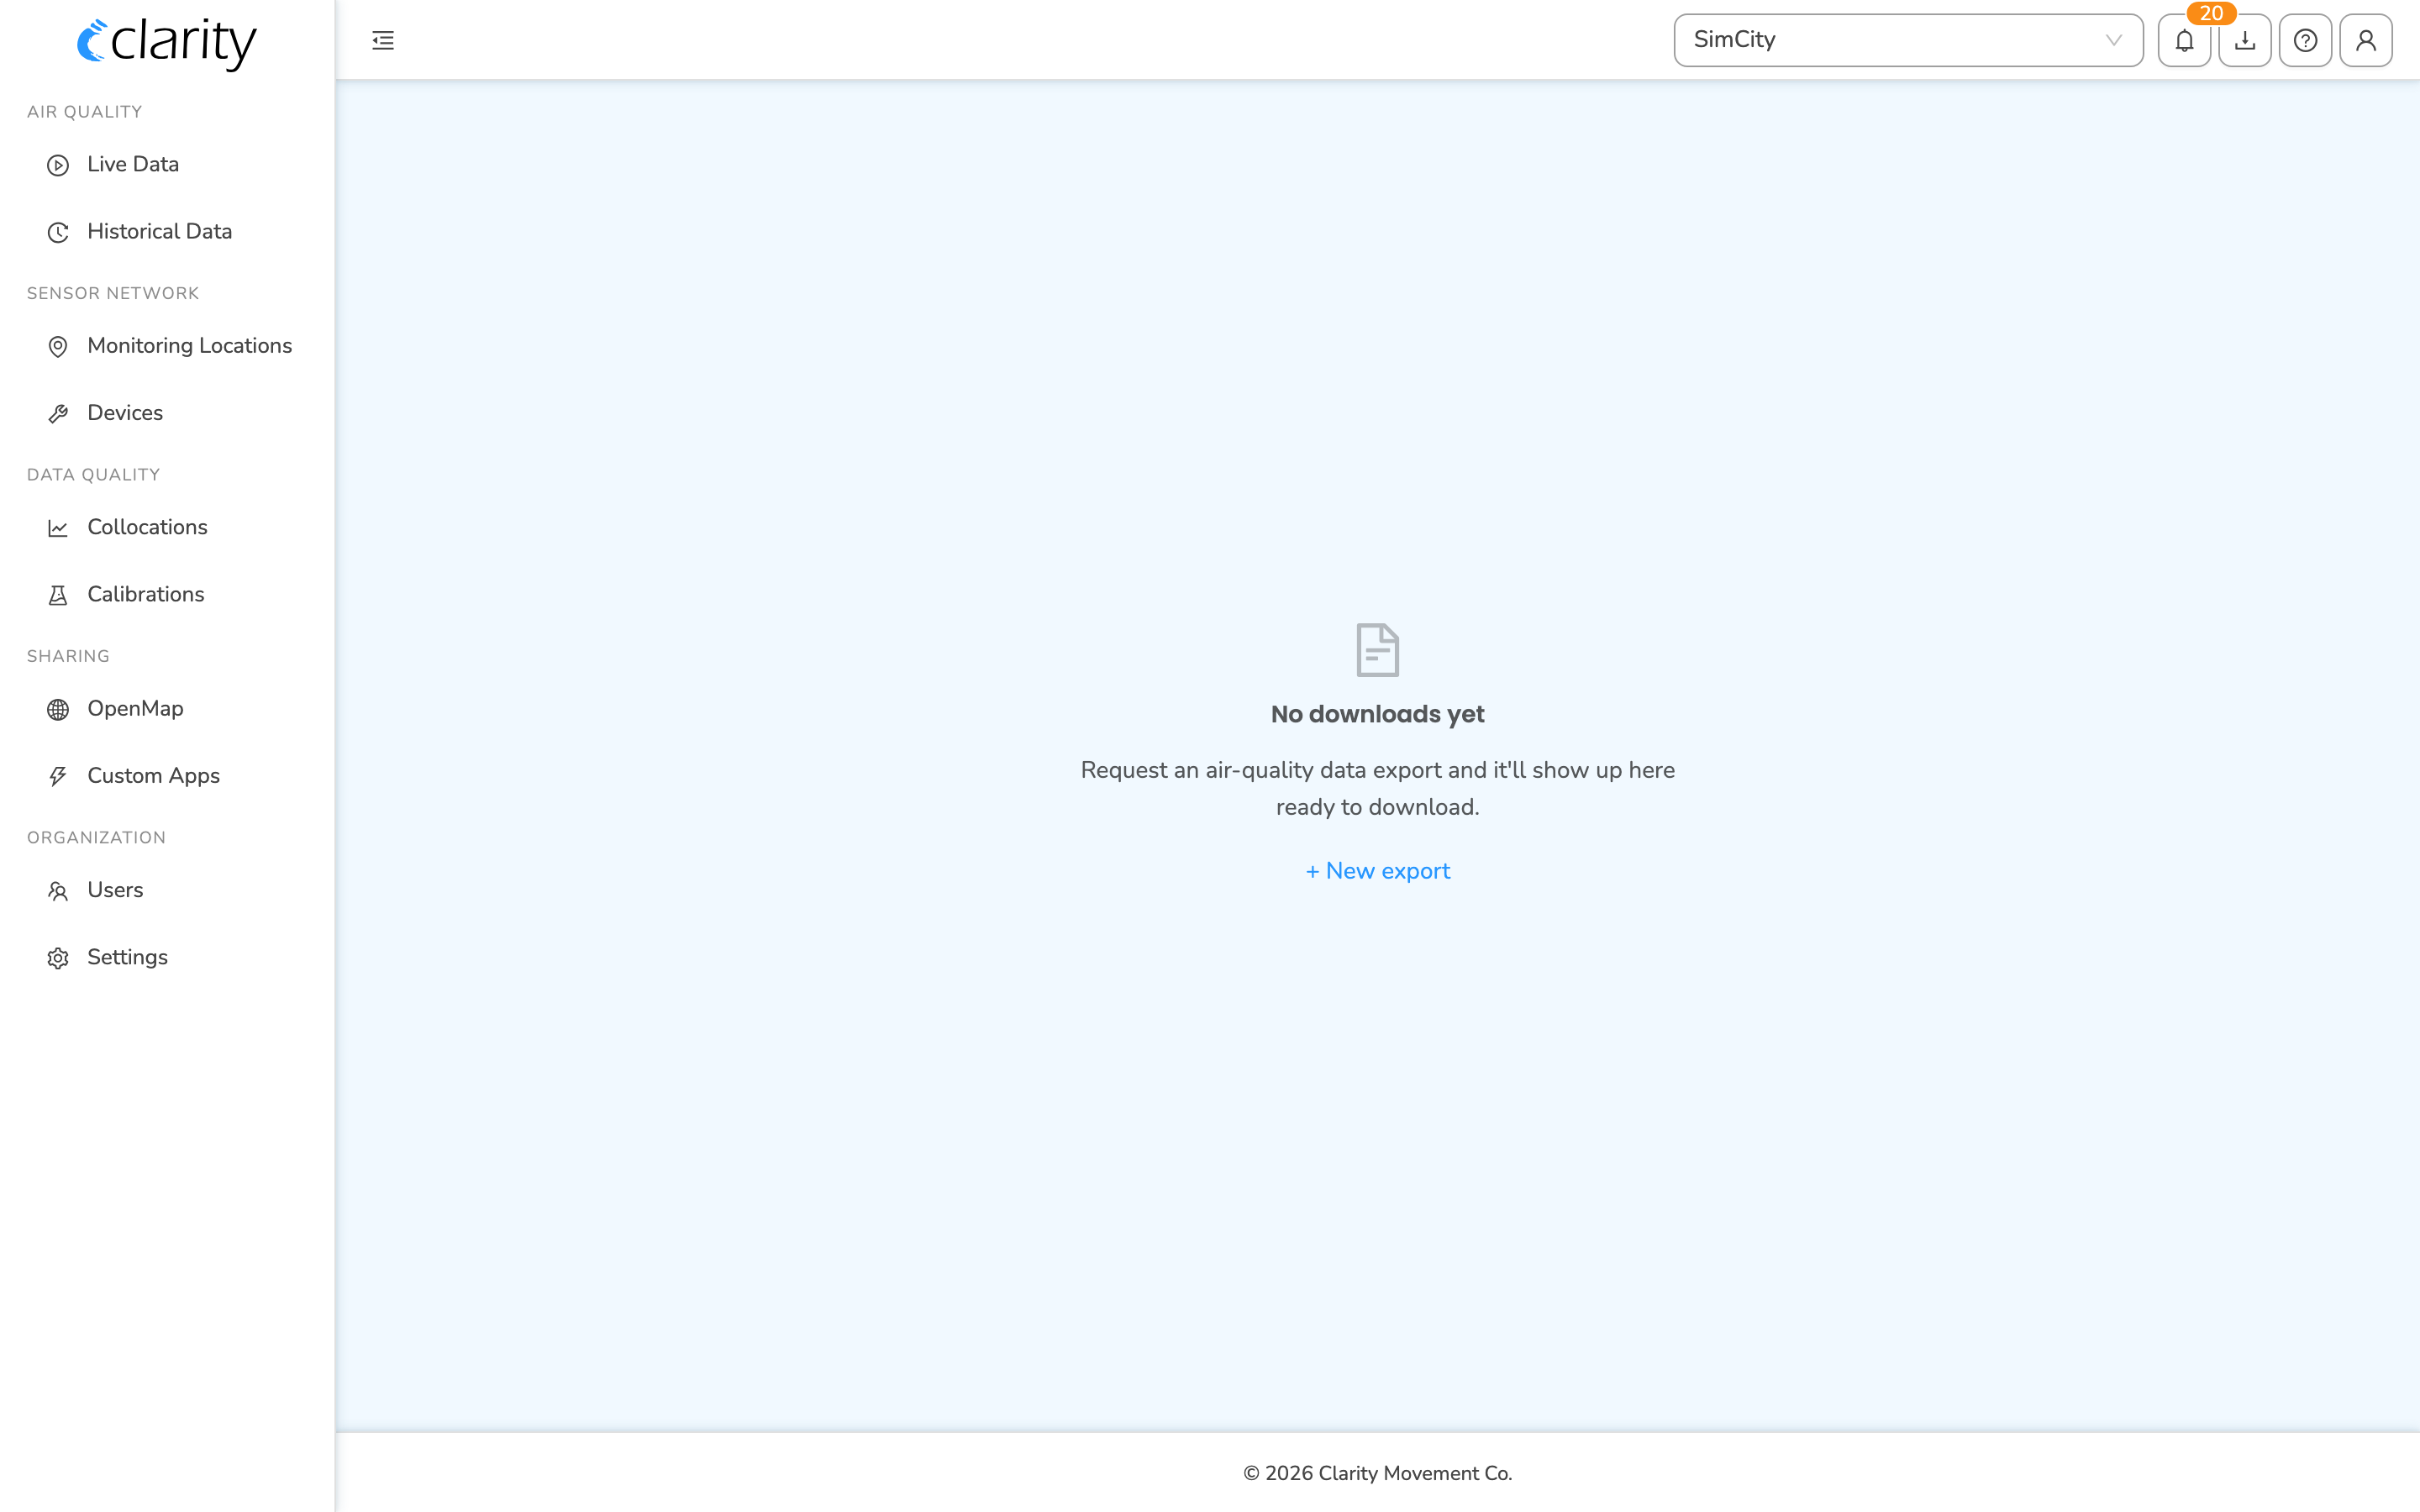
-
If you've never requested an export, you'll see an empty page that says "No downloads yet." Click + New export to begin.
-
If you already have exports, click the New export button at the top-right of the card.
-
The Custom data export dialog opens. Fill it in (see Export options below) and click Submit request.
-
Your export starts preparing in the background. You can keep working — there's no need to wait on the dialog. Track its progress in the top-right download center.
Request an export from Monitoring Locations
Use this when you want to choose locations visually before exporting.
- Open Monitoring Locations from the sidebar (route
/monitoring-locations). - In the locations table (or on the map), select one or more locations. Your selection appears in the panel on the left.
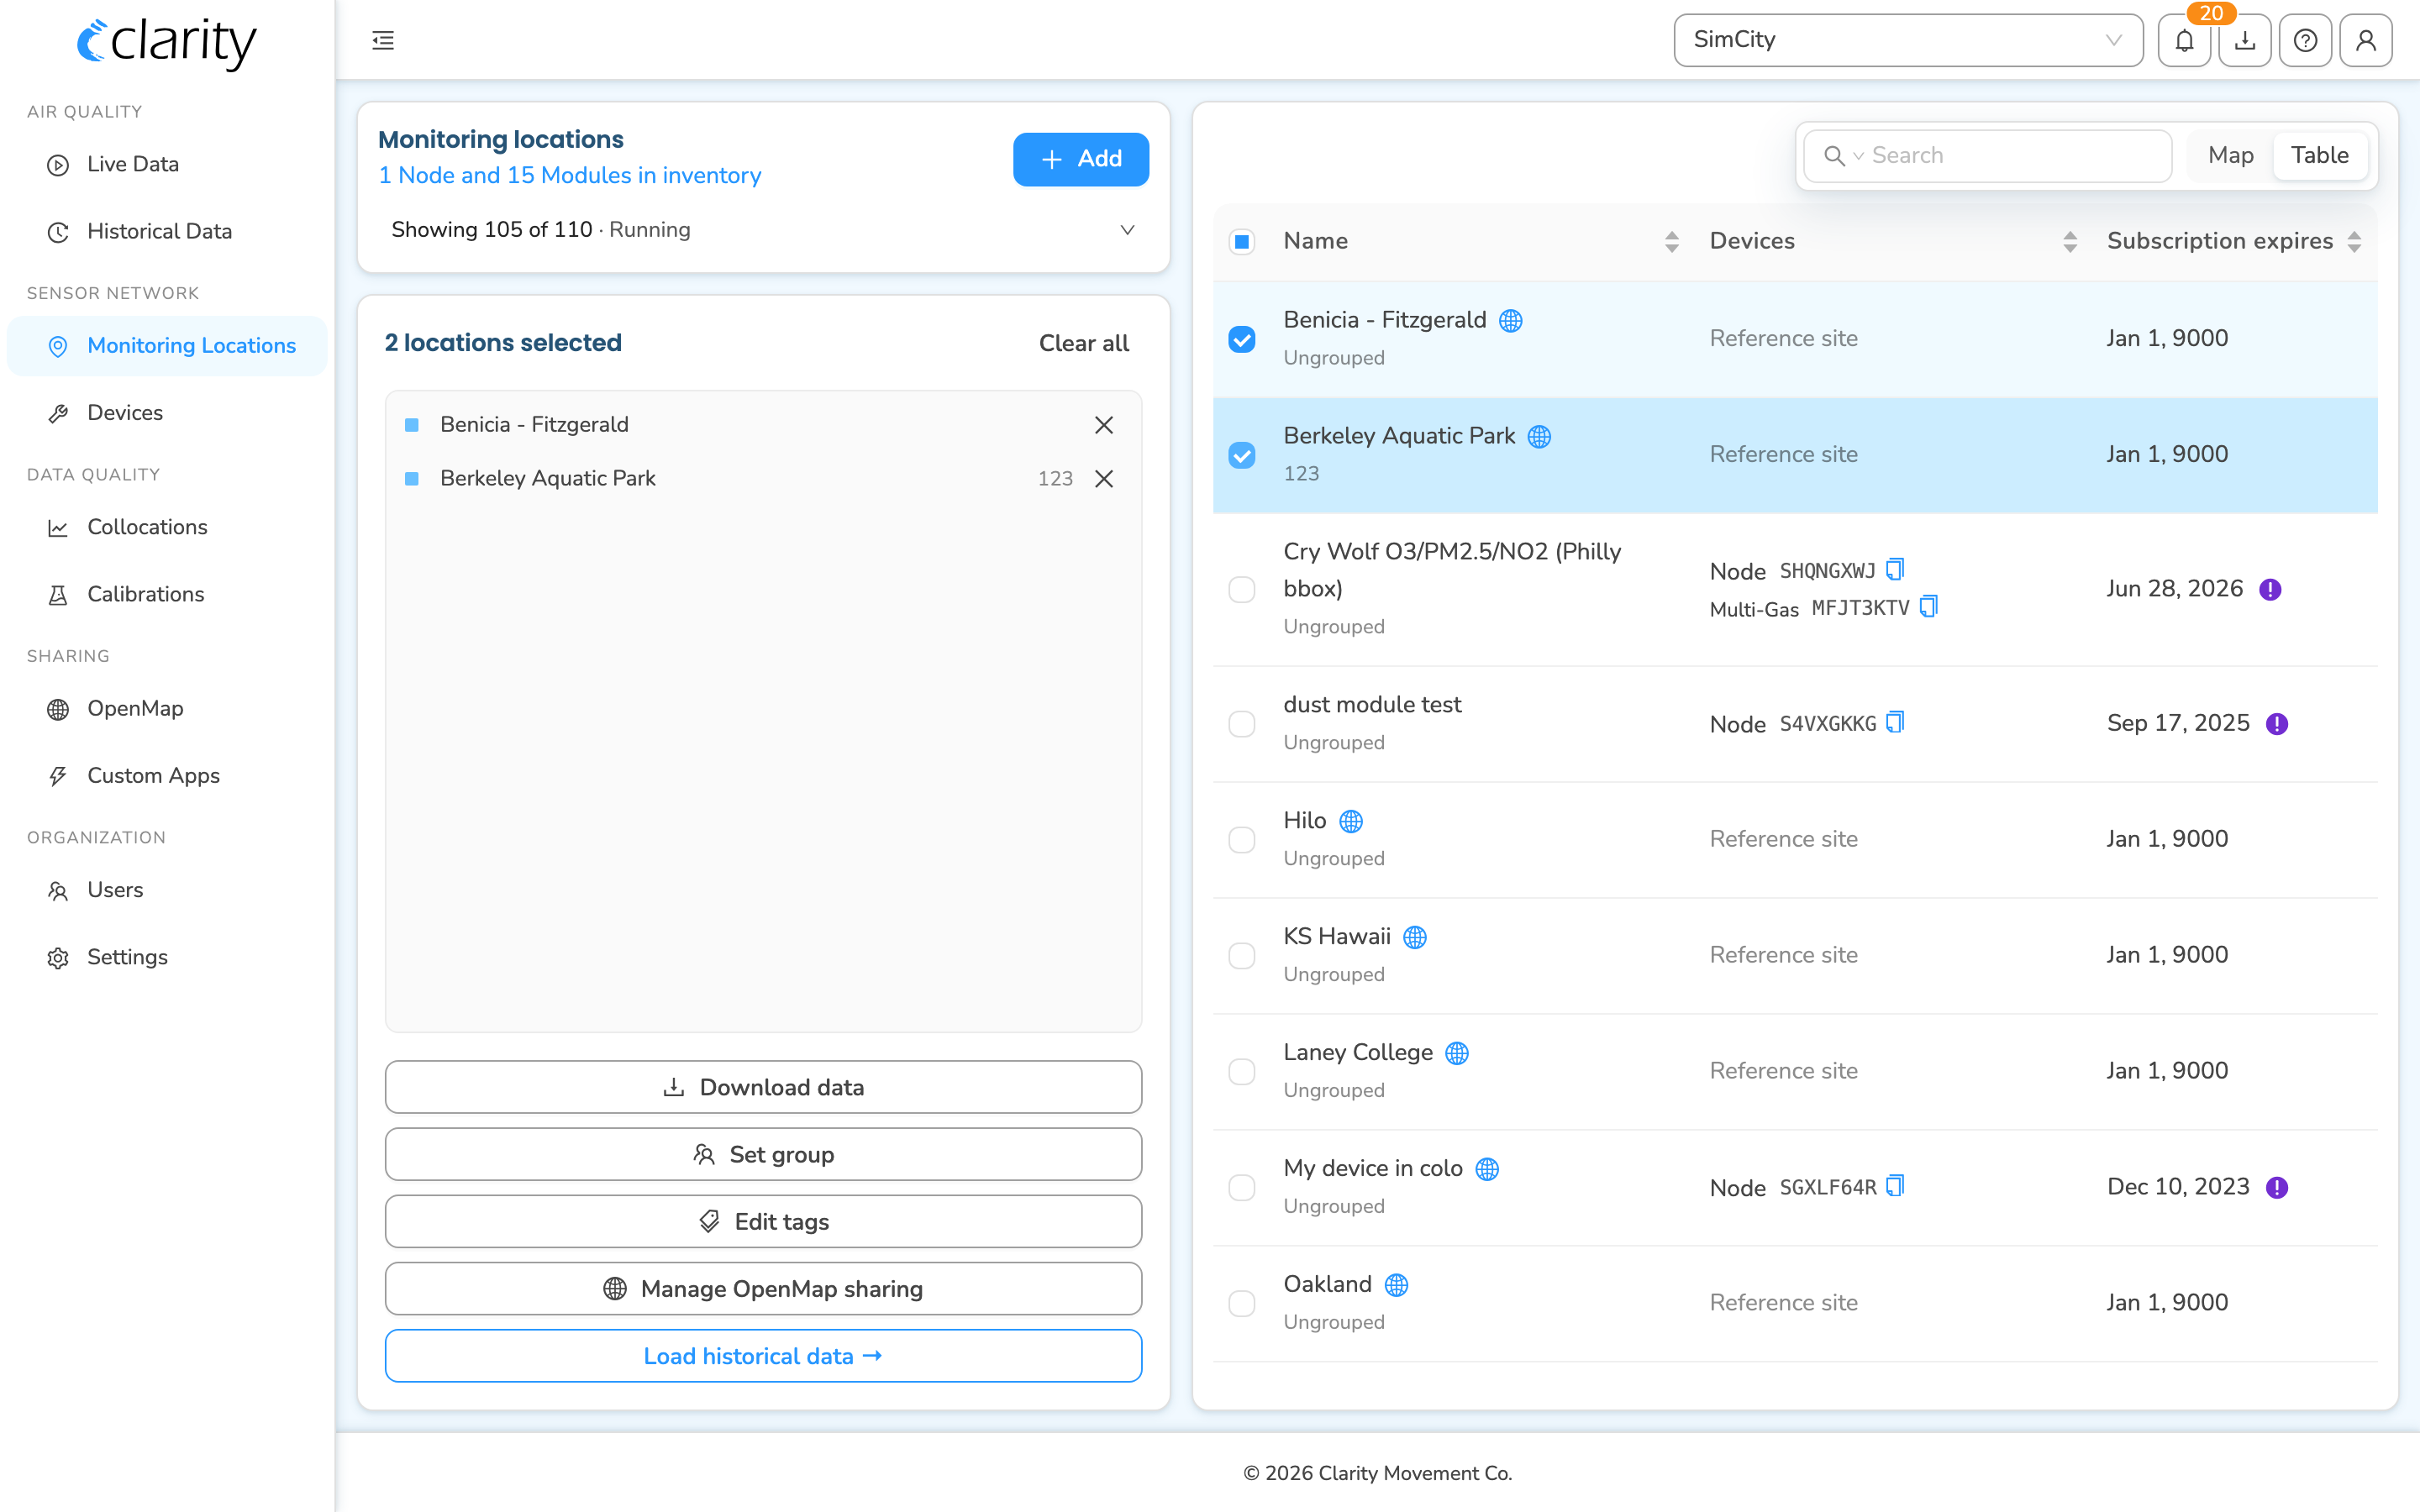
- In that left panel, click Download data.
- For a single location, Download data is in the location's detail panel.
- For several locations, it's at the top of the multi-select panel (which also offers Set group, Edit tags, and Manage OpenMap sharing).
- The Custom data export dialog opens with your selected locations already filled in. Adjust the options and click Submit request.
Request an export from Historical Data
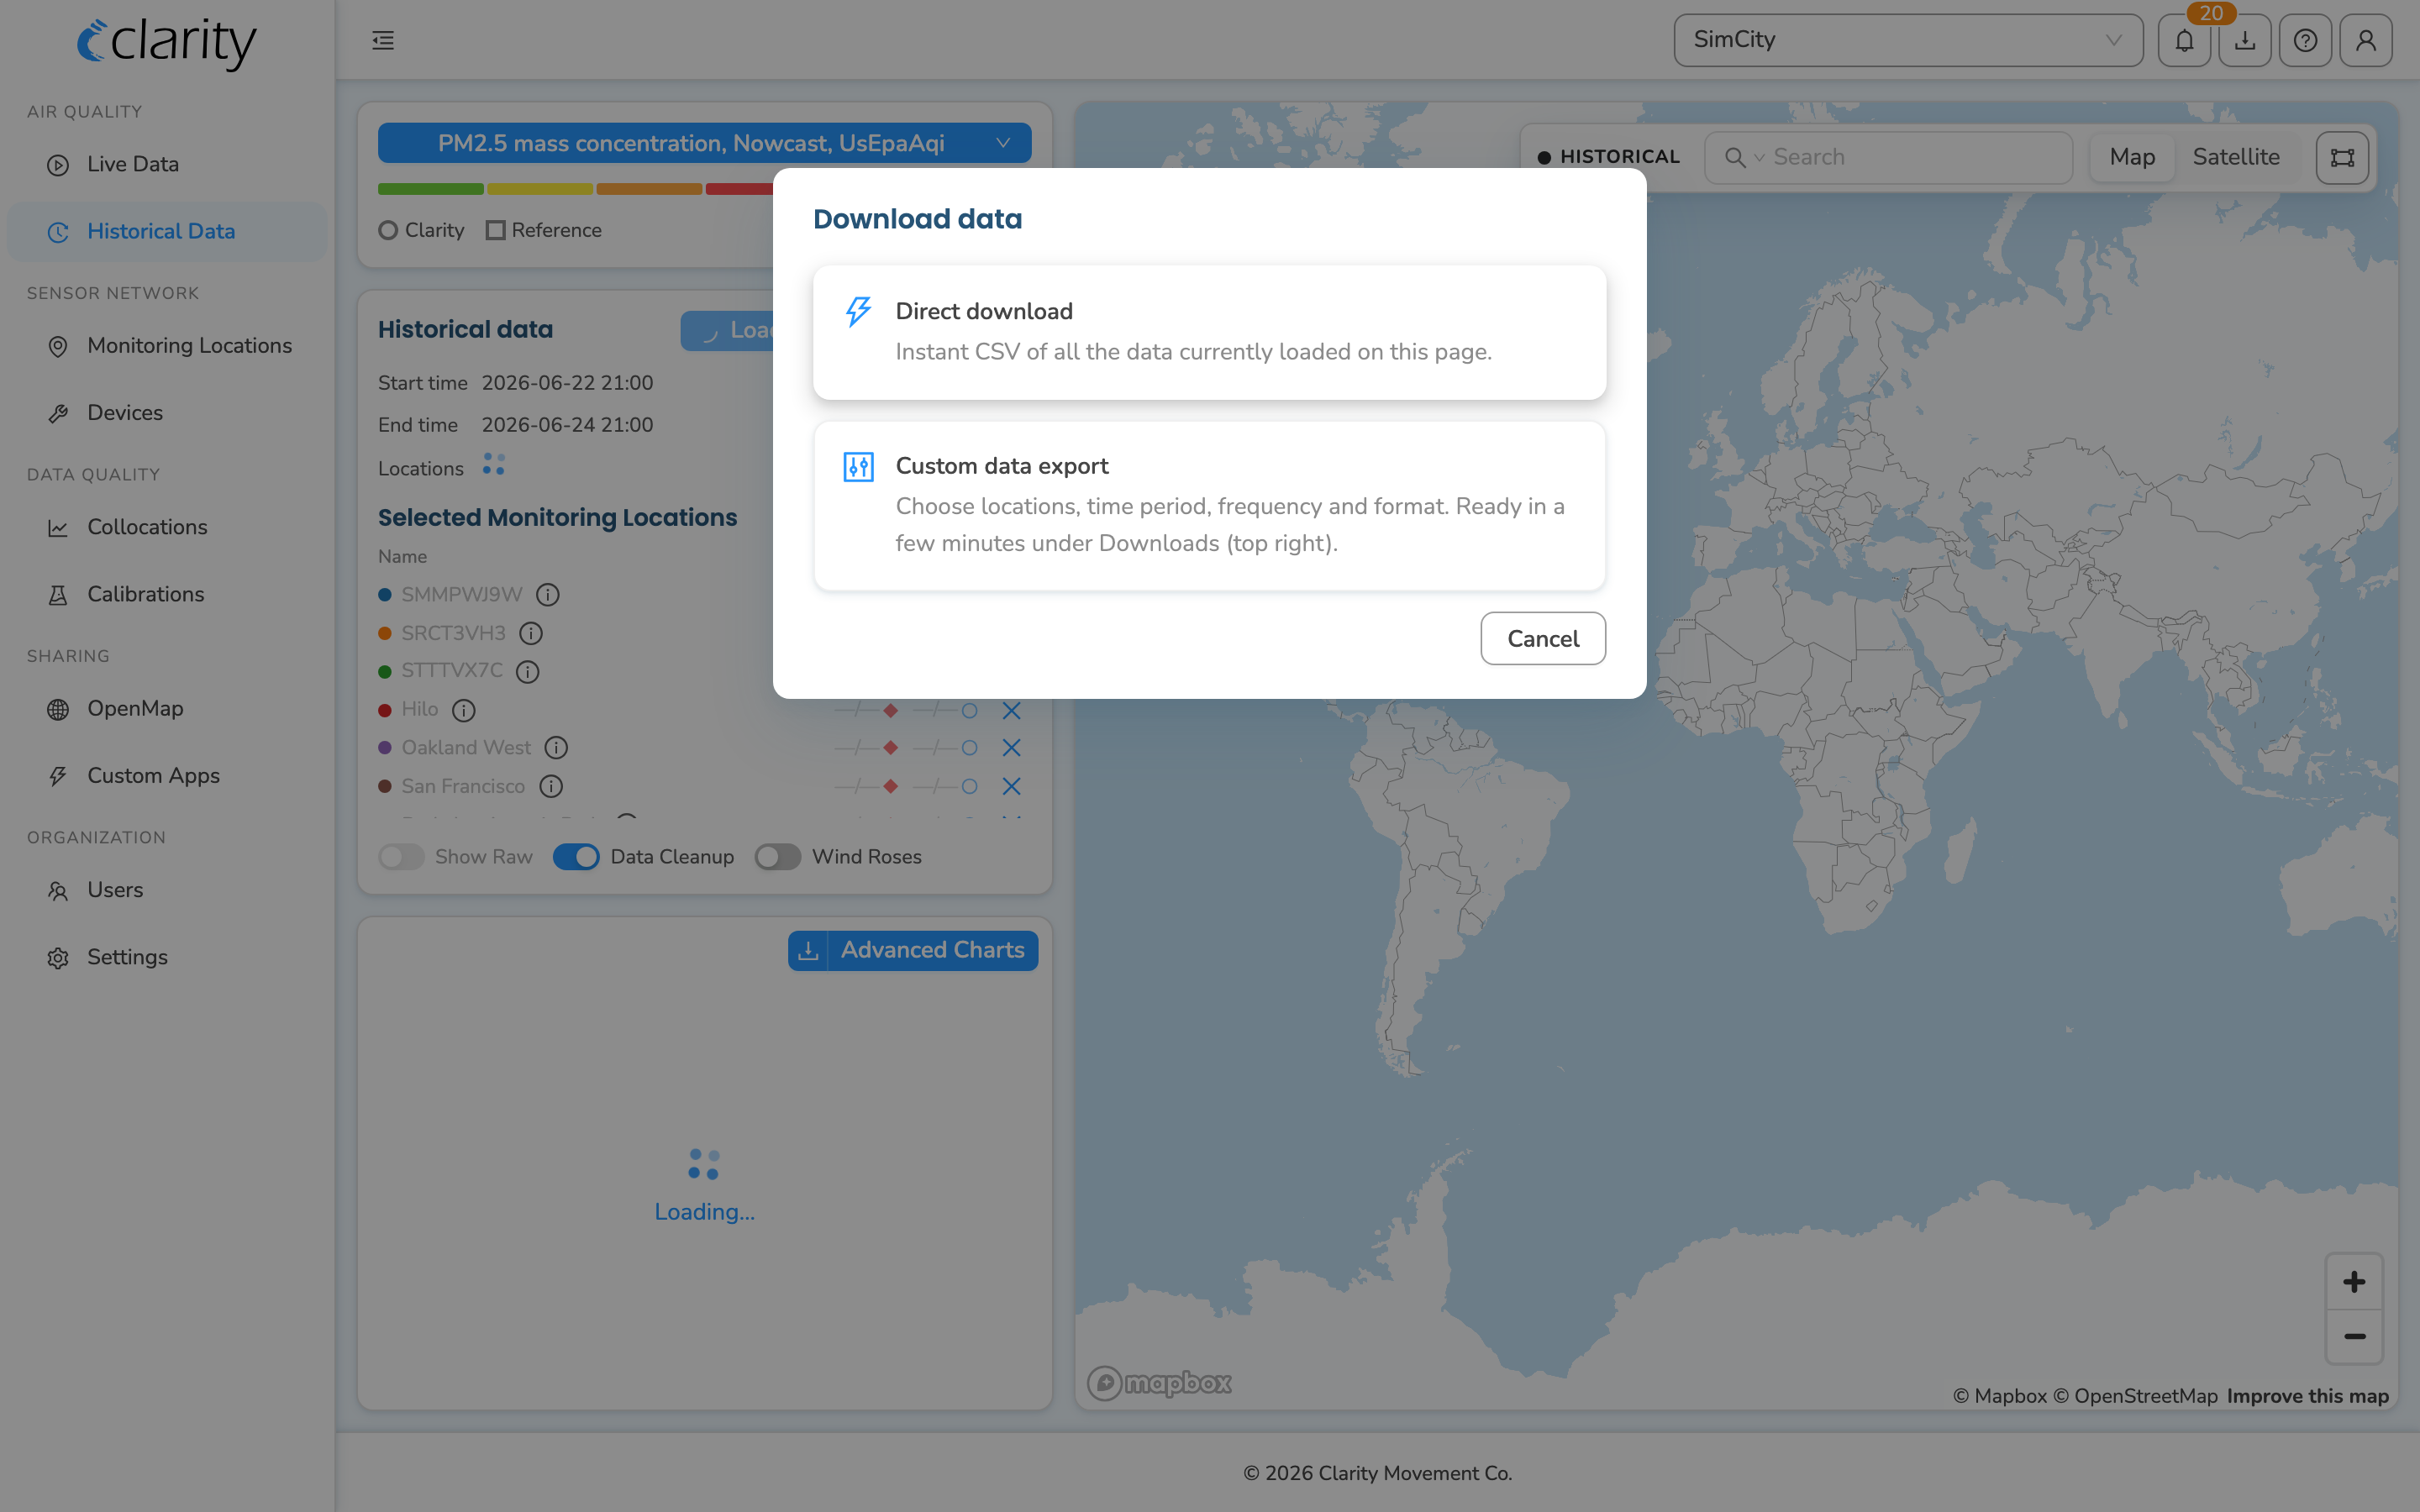
If you're already viewing a chart on Historical Data, the Download button gives you a choice:
- Direct download — an instant CSV of exactly the data currently loaded on the page. Best for a quick grab of what's already loaded.
- Custom data export — opens the same Custom data export dialog so you can choose locations, time period, frequency, and format. Ready in a few minutes in the top-right download center.
Choose Custom data export for anything beyond the visible window.
Track and download your file
Once you've submitted a request, you don't wait on a dialog — the export prepares in the background and shows up in two places.
From the top-right download center
- Click the download icon in the top-right toolbar. The badge shows how many of your exports are still preparing (blue) or newly ready (green).
- The popover lists your recent requests. Each row shows the export type, its scope (number of locations or nodes), and how long ago you requested it.
- When a row reads Ready, click its Download button to save the file in your browser. While it's still preparing it shows a Preparing tag.
- For all of your organization's requests, delete, or request-again, use View and request downloads at the bottom of the popover.
From the downloads list
-
Click the download icon in the top-right toolbar, then View and request downloads. The table lists every export with When requested, Requested by, Export (type + job id), Summary, and Status.
-
Statuses are Processing, Ready, Expired, or Failed. Ready and Expired rows also show a retention date (when the file expires).
-
The list auto-refreshes about once a minute. To refresh sooner, click the refresh icon next to the "Updated HH:MM:SS" stamp in the toolbar.
-
Filter the list with the status segmented control (e.g. show only Ready exports).
-
Click a row to expand its detail panel. There you'll see the full request — export id, who requested it, the locations/nodes, output frequency, time period (UTC), format, label, and any included columns.
-
In the expanded panel, click Download to save the file. The button is disabled until the export is Ready (and stays disabled once it has Expired).
Other buttons in the panel:
- Request again — reopens the export dialog pre-filled with the same settings, so you can re-run or tweak the request.
- Delete — permanently removes the export (with a confirmation).
Export options
Every entry point opens the same Custom data export dialog. Here's what each option does.
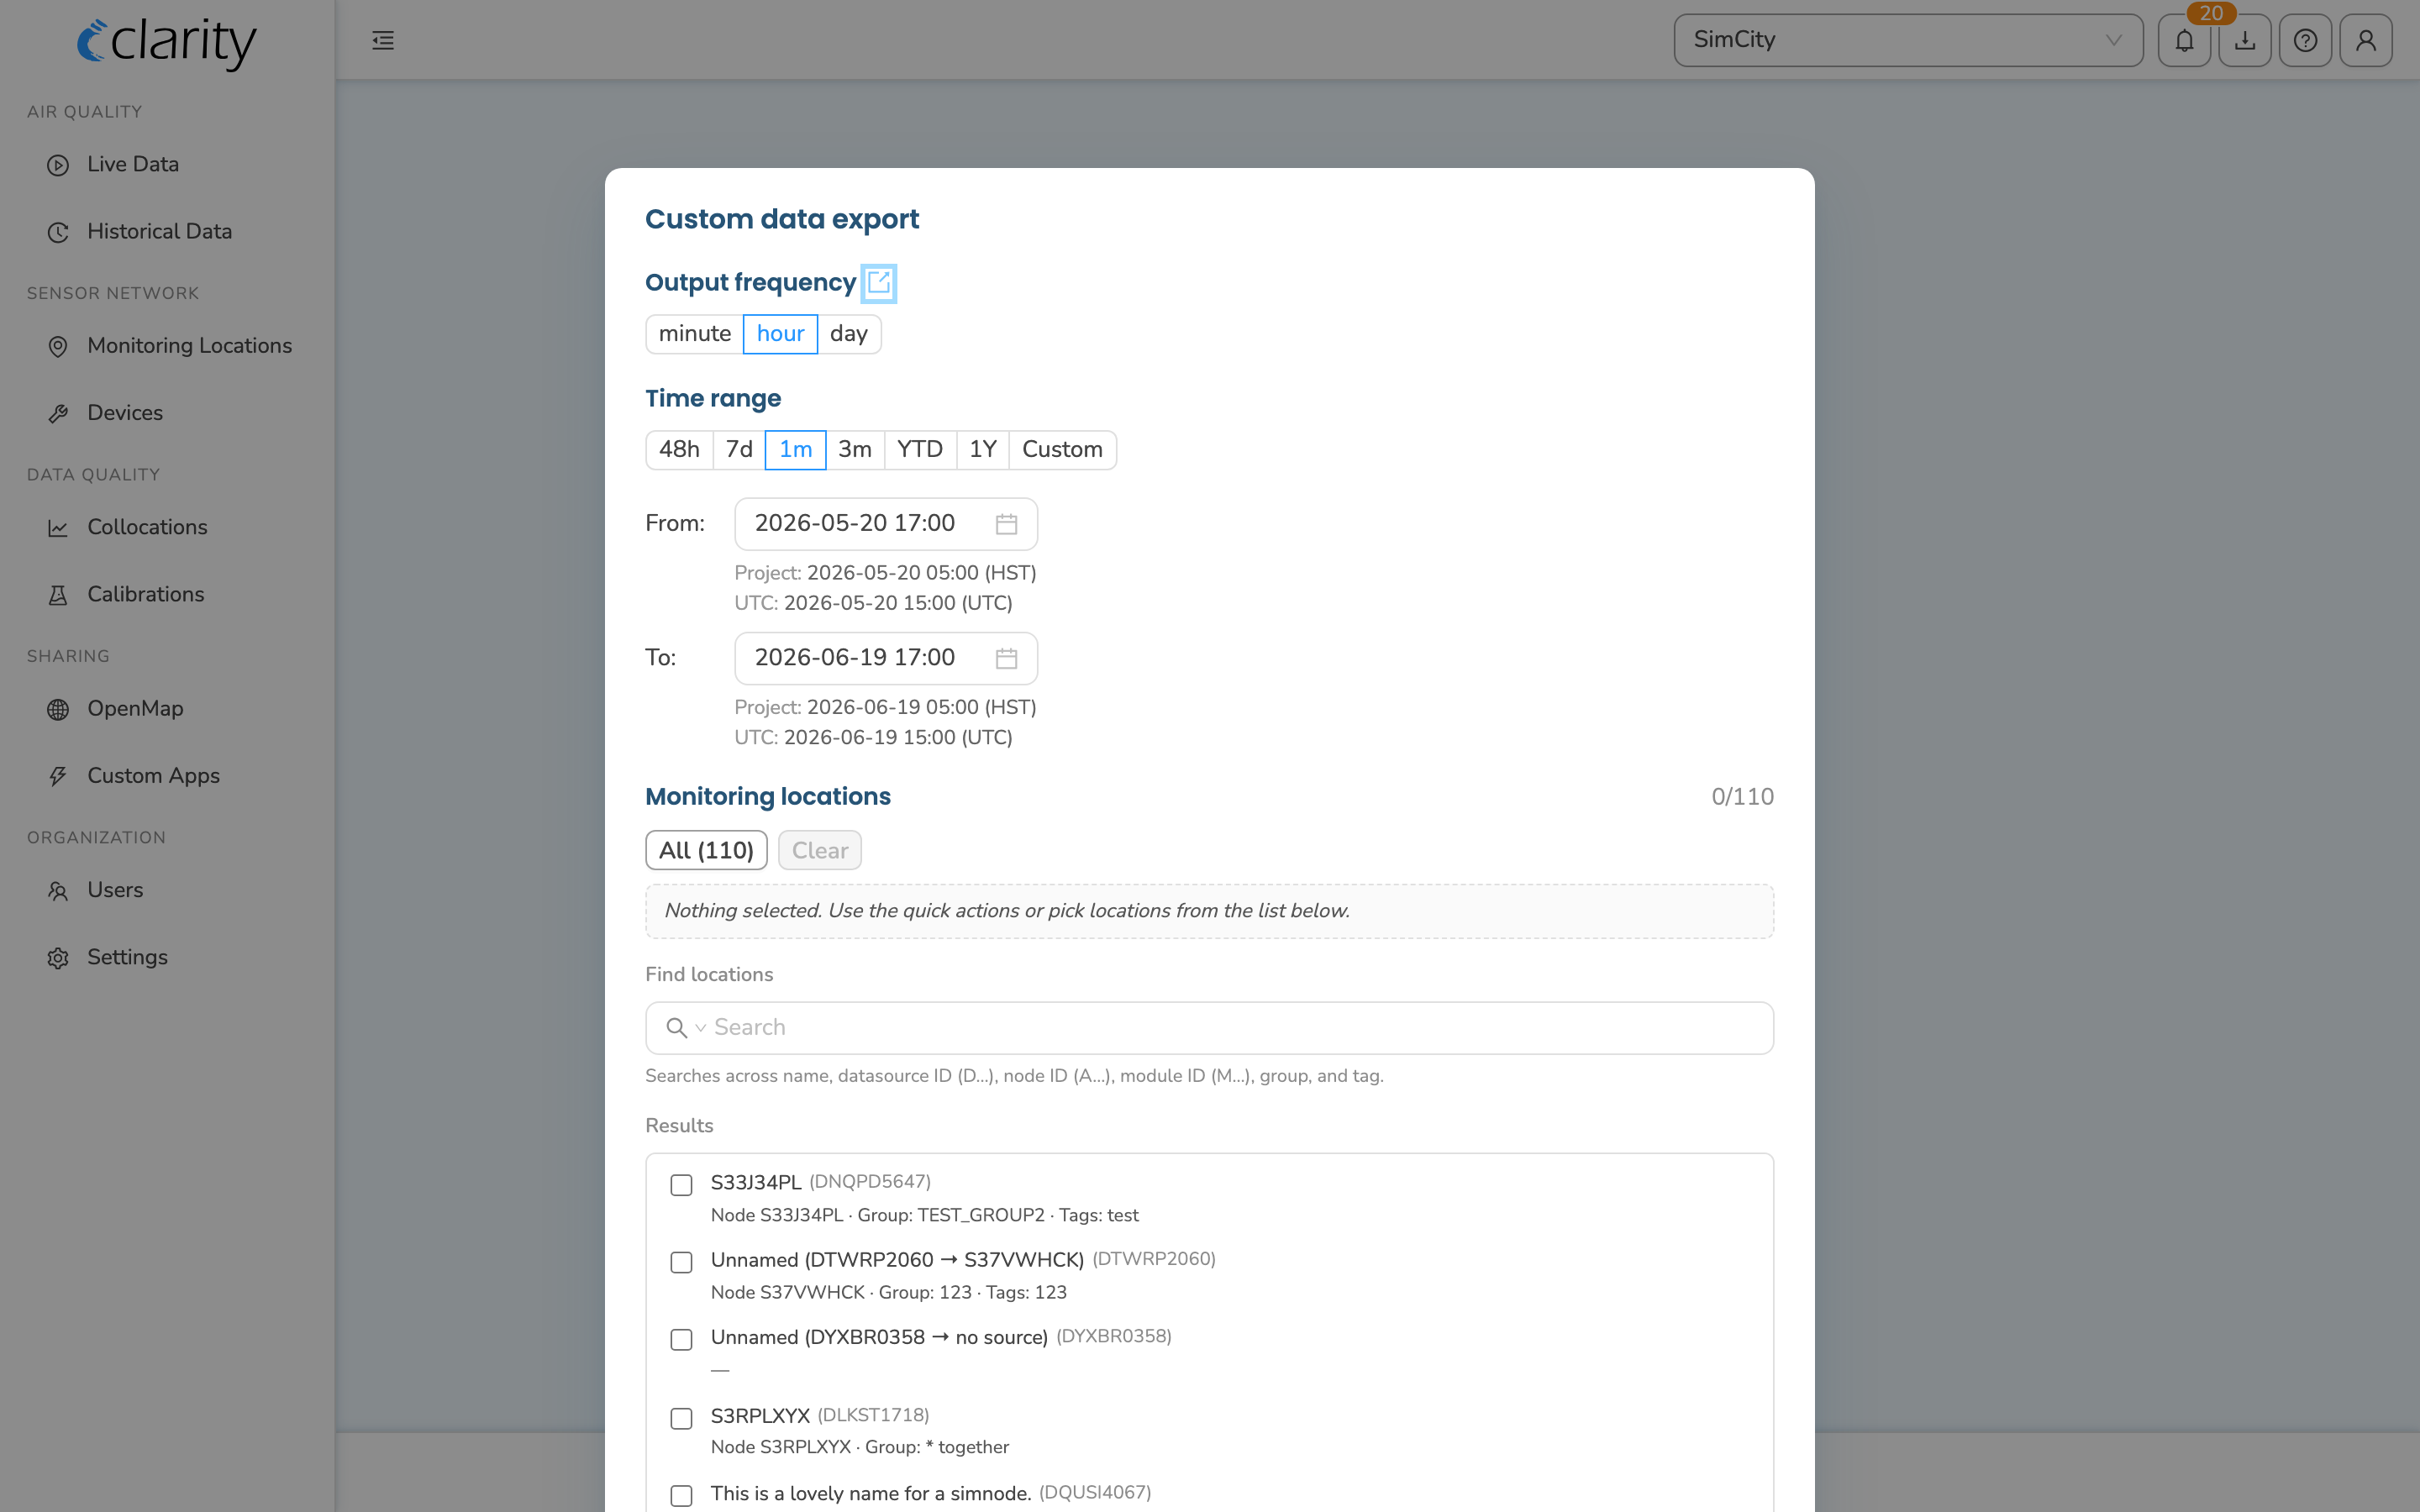
Output frequency
Sets the aggregation used when exporting measurements:
- minute — individual measurements; everything the device sends to Clarity.
- hour — 1-hour mean, NowCast, and 24-hour rolling-mean measurements.
- day — 24-hour mean measurements (00:00:00–23:59:59 UTC).
For full details, see the metrics dictionary.
Time range
Pick the start and end of the period you want, using the date range picker. Times are shown and handled in UTC.
Monitoring locations
The dialog shows a Monitoring locations picker — search and select the locations to include. If you launched from Monitoring Locations or a single location, your selection is pre-filled.
Advanced options
Expand Advanced for finer control.
Format — the file type of the export:
- CSV wide (default) — a CSV file.
- Parquet wide — an Apache Parquet file.
Label — how metric columns are named:
- Default (canonical) — recommended for scripts; each metric is uniquely and easily parsed. Example:
pm2_5ConcMass1HourMean.raw - English — human-readable labels with spaces and commas; easier to read, less suited to code. Example:
PM2.5 mass concentration, 1-hour mean raw - Legacy — the older Clarity style. These labels are ambiguous (one label can map to multiple output frequencies); use only for comparison with existing code, and migrate to Default when you can. Example:
pm2_5ConcMass.raw
Include — optional extra columns you can add:
- QC assessment
- QC flags
These help you filter out invalid data during analysis.
Metrics — which air-quality parameters (columns) to include:
- Default — the most commonly used columns.
- By key — pick metrics one by one in a selector (the selector follows your chosen output frequency).
- By select — type a filter string, as described in the metrics-select API docs.
Note: If you use add-on modules, some of the parameters they monitor may not be in the Default metric set. Switch to By key or By select to add them.
When you're done, click Submit request. You'll see "Export requested — track its progress under Downloads (top right)."
Daily limit: There's a daily quota on exports. If you hit it, you'll see "Daily quota of exports exceeded" — try again the next day.
Report columns and units
Need help interpreting the column labels in your file, or want to know the units the values are reported in? See Interpreting Reports.
What's next
- Customize CSV columns when downloading.
- See all the ways to access your data.
- Understand how measurements are averaged.
- Check the time zone of your measurements.
Was this article helpful?
Yes, thanks! / Not really
Still need a hand? Email us at support@clarity.io or create a support ticket, and our team will get back to you.