Using Dashboard to compare measurements of a Node-S that is collocated with a reference monitor
How to use the Collocations page on Dashboard to view comparison charts and accuracy metrics such as R² and RMSE.
Tip
- The Collocations page lets you compare a Clarity node against a nearby reference monitor, with the correlation coefficient (R²), root mean squared error (RMSE), and side-by-side plots all in one place.
- Nearby reference-monitor data that is publicly available is added to your account automatically. Once a Clarity node and a reference site are both active and within 200 m of each other, the pair shows up on this page on its own — there is nothing to set up.
- To learn more about the statistics, read:
Note Collocations compares averaged data only — hourly by default, with a daily option in the custom range. It does not work on raw minute-level readings.
What a collocation is
A collocation is a Clarity node sitting within 200 m of a reference site. Clarity finds these pairs for you automatically by comparing the locations of your nodes against known reference sites — you don't create or configure them. When a qualifying pair exists, it appears in the Collocated Pairs list on this page.
Open the Collocations page
- Go to the Clarity Dashboard and sign in.
- In the left sidebar, find the Data quality group and select Collocations.
That's it — Collocations is its own top-level page. Old links such as /analytics/colocations or /colocations redirect here automatically.
How the page is laid out
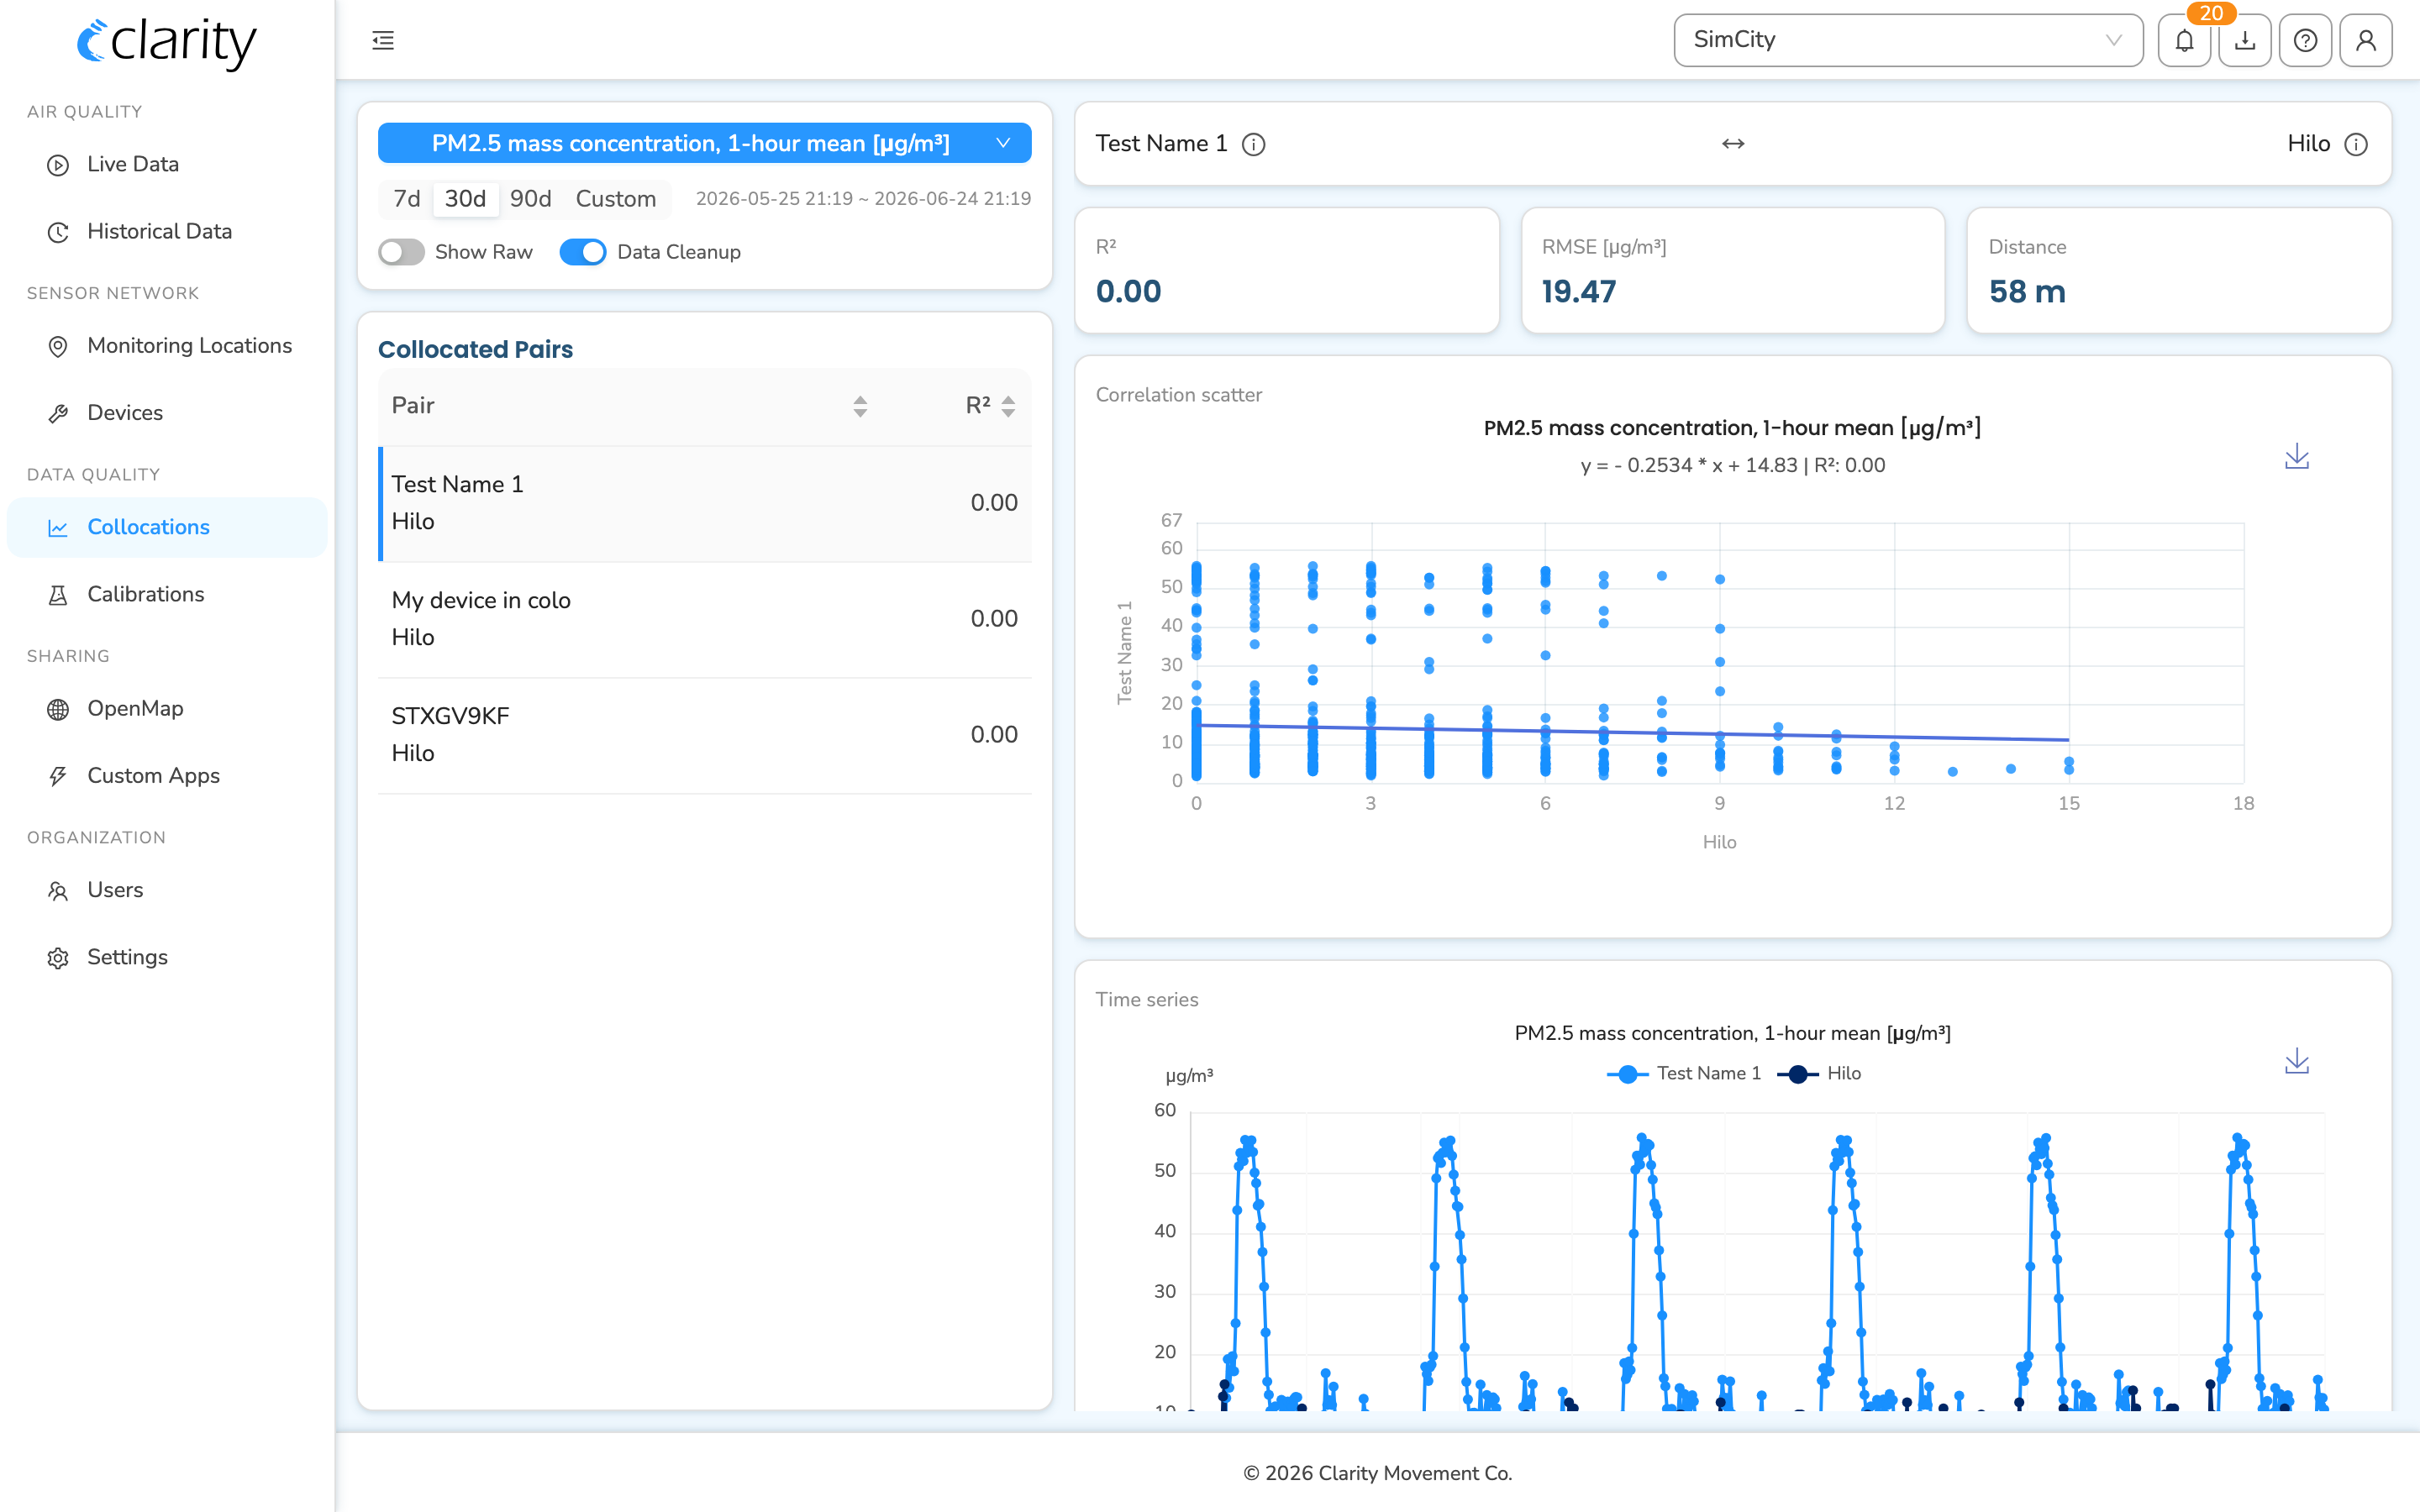
Collocations is a single page split into two columns:
- Left column — a controls card (parameter, time range, and data toggles) sitting above the Collocated Pairs list.
- Right column — the detail workspace for whichever pair you select. Until you pick one, it shows a short prompt.
The controls at the top left apply to the whole page: changing the parameter or time window updates both the pairs list and the charts on the right.
Choose what to compare
In the controls card at the top of the left column:
- Parameter — click the blue parameter pill (it defaults to PM2.5 mass concentration, 1-hour mean [µg/m³]) to pick a different pollutant or metric. Collocation analysis centers on the underlying mass concentration rather than AQI buckets, which is why PM2.5 1-hour mean is the default.
- Time window — use the segmented control to choose 7d, 30d (the default), or 90d. The resolved start and end of the window appear just to the right of the buttons.
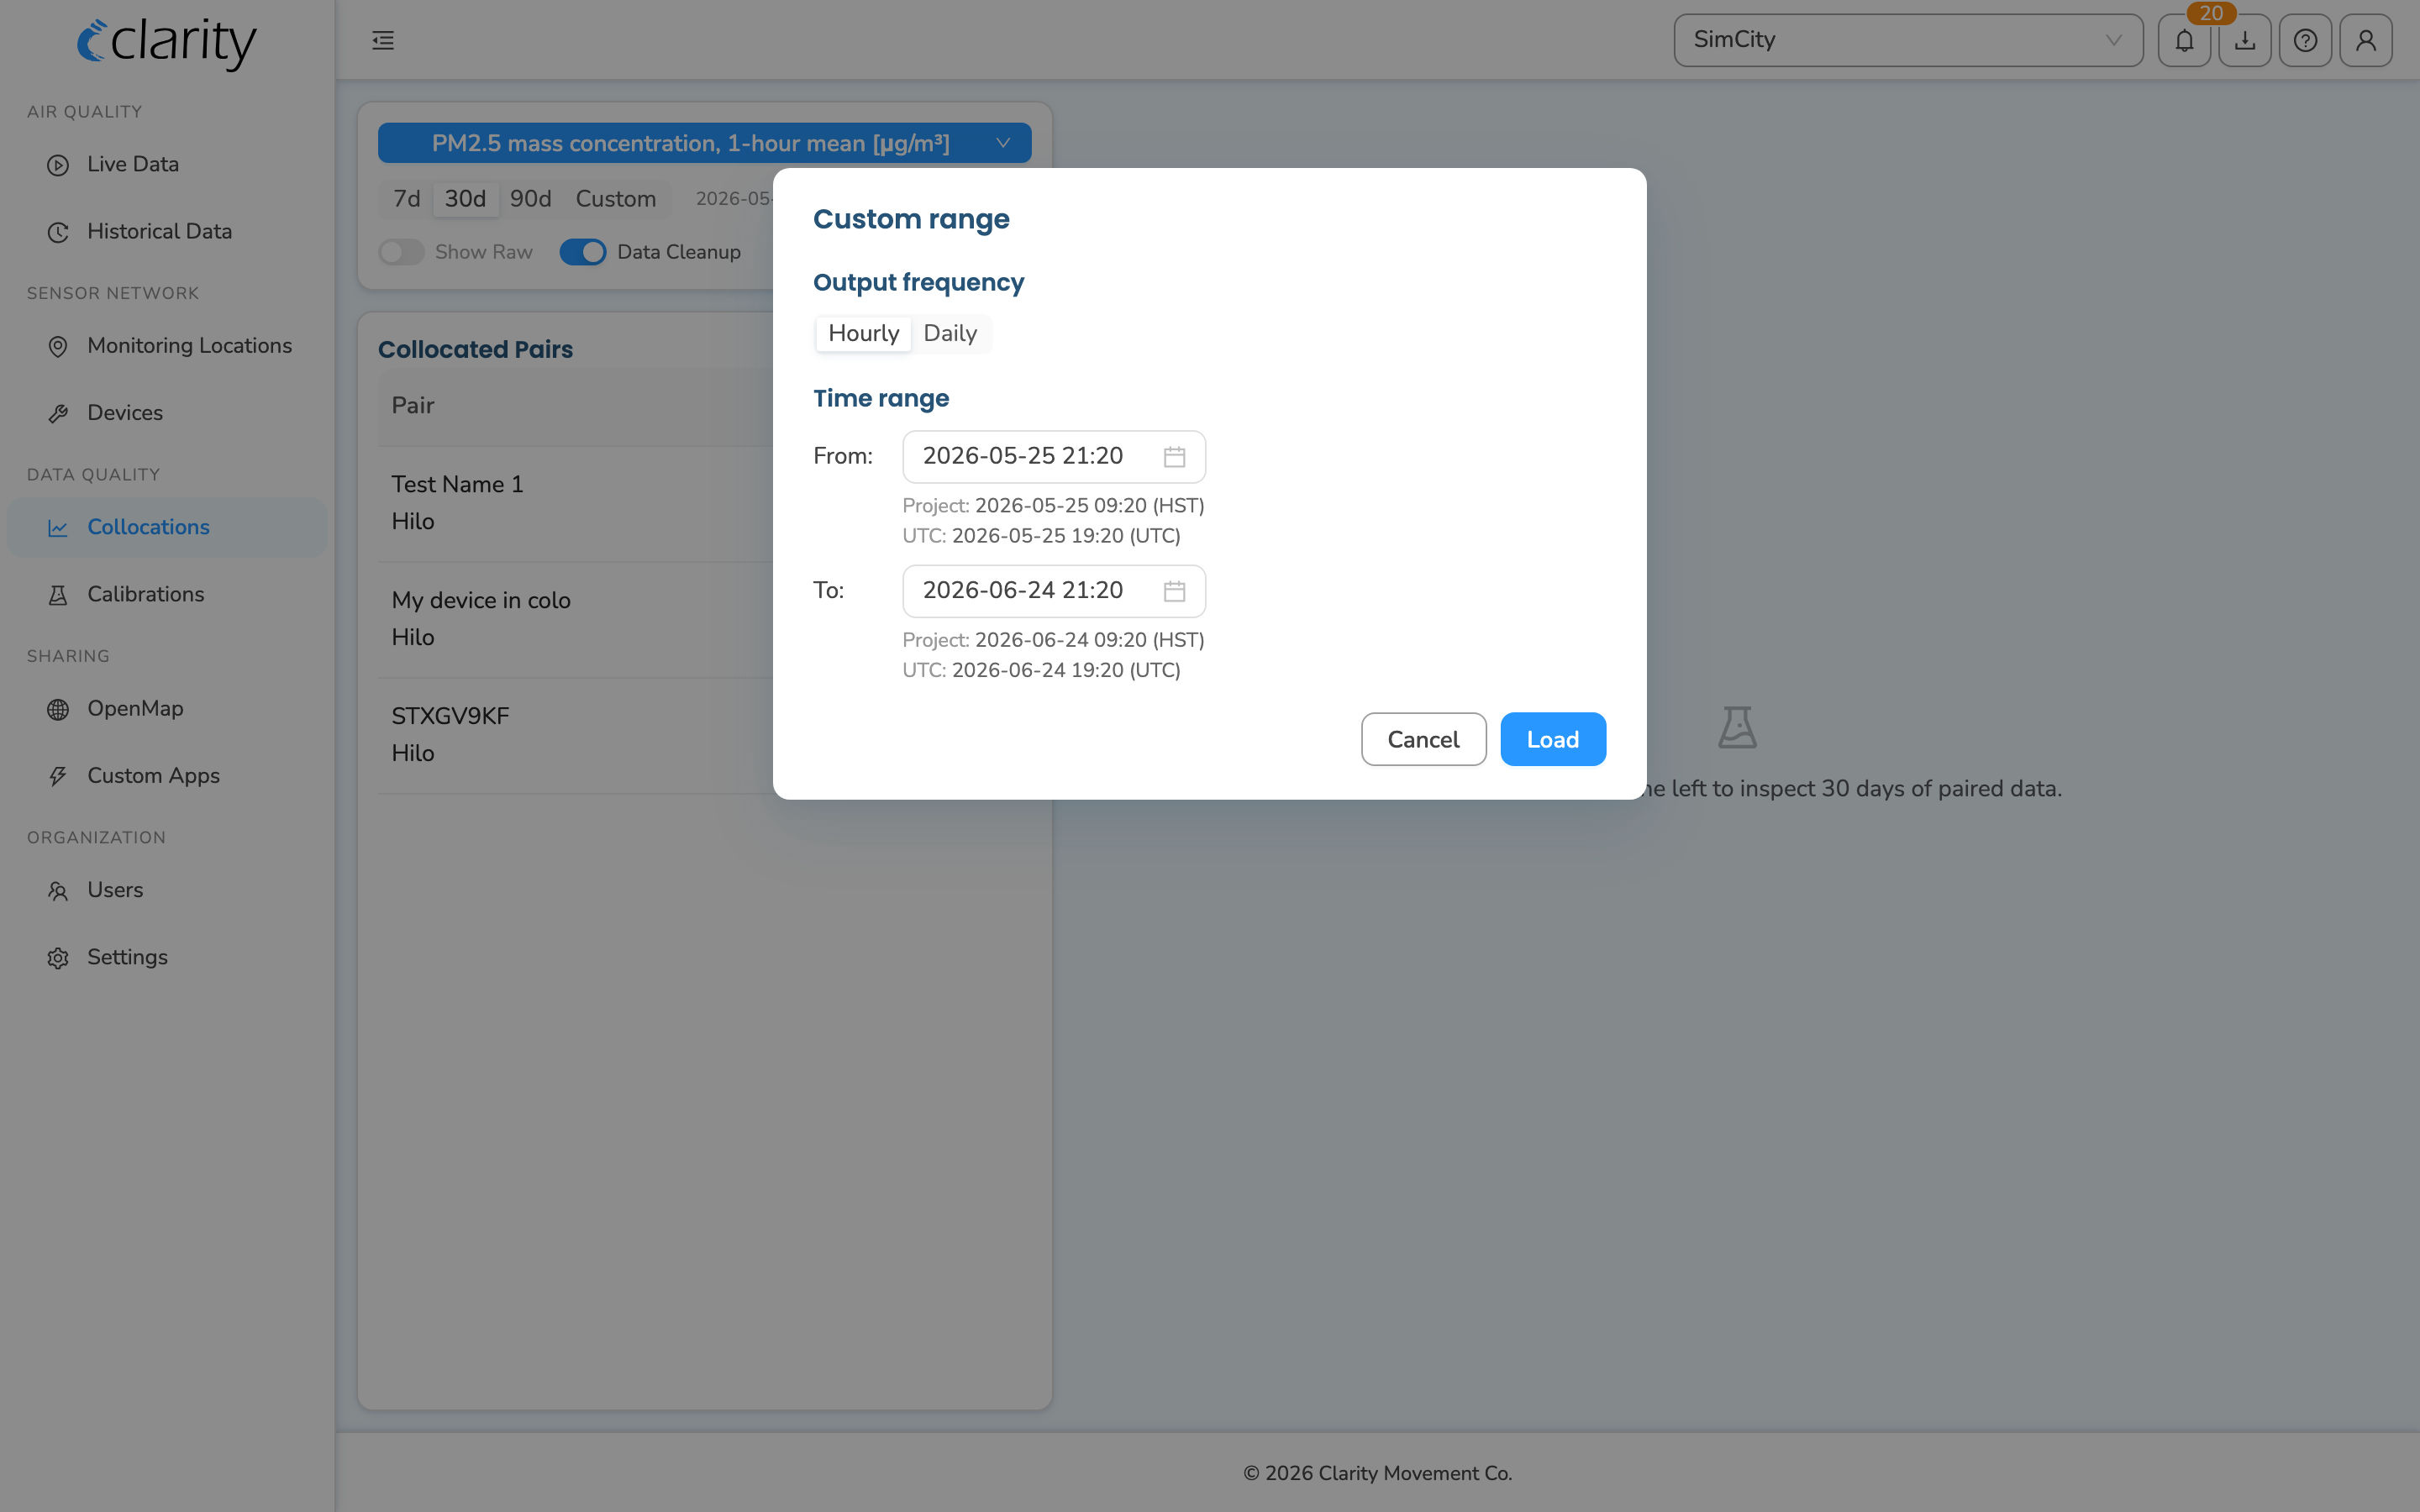
- Custom range — click Custom to open the Custom range dialog, where you set an explicit start and end and switch the Output frequency between Hourly and Daily. Click Load to apply it.
Data toggles
Two switches at the bottom of the controls card control how the measurements are treated:
- Show Raw — show raw, non-calibrated measurements. This is locked for index and NowCast metrics; when it's disabled, the tooltip explains why.
- Data Cleanup — remove QC-invalid values and values that are missing calibration. This is the recommended view for performance comparison; it's on by default for most orgs and turns off automatically while Show Raw is on.
Read the Collocated Pairs list
Below the controls, the Collocated Pairs table lists every Clarity-node ↔ reference-site pair in your organization. Each row stacks the two location names and shows:
- Pair — the Clarity device name on top and the reference site name below it.
- R² — the correlation coefficient for the selected parameter and window. While the data is still loading, this column shows a small spinner; once it's ready, the list sorts best-correlation-first by default. Distance and RMSE appear in the detail pane's stats strip, described below.
Click any row to open its detail view on the right. You can also click a column header to re-sort by pair name or by R².
Inspect a pair in detail
Selecting a pair fills the right column with everything you need to evaluate that node against its reference monitor:
- Pair header — the two locations side by side, joined by a
↔to show they are peers. Click the (i) icon next to either name to open a popover with that location's details (device, modules, health, last reading) and quick links to open it in Live Data or manage it in the sensor network. - Stats strip — three at-a-glance tiles:
- R² — correlation coefficient.
- RMSE [unit] — root mean squared error, in the parameter's unit.
- Distance — how far apart the node and reference site are, in meters (always under the 200 m threshold).
- Correlation scatter — reference monitor (X axis) vs. Clarity node (Y axis), with the regression line and R² shown under the title.
- Time series — the Clarity node and the reference site plotted together over the selected window.
- Histogram — the distribution of concentrations for each device in the pair.
- Deviation — the per-measurement absolute error, with the RMSE drawn as a reference line.
If you have data points flagged by QC or missing calibration, an indicator on the stats tiles notes that (when Data Cleanup is on).
Share or return to a specific pair
When you select a pair, the page adds a ?collocationPair=… value to the URL. Copy that link to send someone straight to the same pair, or to bookmark it — reopening the link reselects that pair for you.
When there's nothing to compare yet
- No collocations in this org — your organization has no Clarity node within 200 m of a reference site yet. Once you have both nearby, the pair appears here automatically. (This is the state shown in the screenshot above for the example org.)
- Pick a collocation on the left — you have pairs, but haven't selected one yet. Choose a row in the Collocated Pairs list to load its 30 days of paired data.
What's next
- Collocate your device with a reference monitor.
- Understand what R² and RMSE mean.
- Check a device's calibration.
- Explore Reference Monitor data on Dashboard.
Was this article helpful?
Yes, thanks! / Not really
Still need a hand? Email us at support@clarity.io or create a support ticket, and our team will get back to you.