Clarity Node-S and Add-on Modules overview
The Clarity Node-S is the core building block of Clarity's Sensing-as-a-Service platform, and add-on modules extend what a single deployment can measure. This article covers the hardware itself and then shows where the data each device produces shows up in the Dashboard — including the wind/pollution rose visualizations and the Black Carbon source-apportionment view.
Clarity Node-S
As the key building block of Sensing-as-a-Service, the Clarity Node-S is an advanced IoT device designed for comprehensive air quality monitoring, featuring:
- Versatile sensing: Equipped with on-board sensors for particulate matter (laser light scattering), nitrogen dioxide (electrochemical cell sensor with selective filter), temperature, and humidity, the Node-S can also be expanded with add-on modules to extend its measurement range.
- Measurement accuracy: Certified by MCERTS for high accuracy, validated through multiple third-party tests and collocation studies across diverse environments.
- Self-sustaining power: With an integrated solar power harvesting and storage system, it operates autonomously, eliminating the need for outdoor power outlets. Its battery supports operation for 30 days without any sunlight.
- Seamless connectivity: Out-of-the-box cellular connectivity enables continuous data transmission to the Clarity Cloud, supporting reliable real-time monitoring.
- Fast deployment: Designed for straightforward field deployment and includes mounting brackets for flexible installation options.
- Rugged durability: Built to endure diverse environmental conditions, the Node-S has an average operational lifetime of 3.5 years. It's UV-resistant, weatherproof, and boasts an IPX3 ingress protection rating. It is FCC and CE certified.
- Remote status monitoring: The Clarity Dashboard lets you remotely monitor device status and troubleshoot hardware issues, improving maintenance efficiency.
- Customizable configuration: You can configure the device through the Clarity Dashboard, assigning a monitoring location and streaming its measurements.
This robust, flexible device powers accurate and scalable air quality monitoring.
Terminology note: The Dashboard labels the place where a device streams its measurements a Monitoring Location. The data-model term "datasource" still exists behind the scenes, but in the UI you'll see "Monitoring Locations" — for example in the Sensor network → Monitoring Locations sidebar entry and in the "Selected Monitoring Locations" list on the Historical Data page.
Add-on modules
Clarity offers several add-on modules that can be paired with Node-S air quality monitoring devices. These modules expand the capabilities of the base system by adding new measurement capabilities. The add-on modules available are:
- Wind Module: An anemometer that collects data on wind speed, wind direction, ambient temperature, humidity, and barometric pressure. It enhances the environmental data collection capabilities of the sensor network.
- Ozone Module: Uses Federal Equivalent Method (FEM) capable technology to measure ozone concentration. It's particularly useful for customers in areas with ozone attainment issues.
- Black Carbon Module: Measures black carbon, an extremely harmful component of particulate matter. It's important for assessing impacts on human health, agricultural productivity, and global warming.
- Multi-Gas Module: Expands the capabilities of the Node-S, enabling real-time measurement of CO, O₃, NO₂, NO, and NOx — five key pollutants that impact air quality and public health.
These add-on modules are designed to integrate seamlessly with the Node-S platform. They are based on industry-leading technology and undergo a rigorous selection and testing process before being made available to ensure reliability and quality.
How modules are paired in the Dashboard: Pairing a module to a node is a self-service wizard. Go to Sensor network → Devices and use the top-right Pair module button (the
/devices/pair-a-modulewizard). For node setup, use Configure node (the/configure-nodewizard) on the same page.
Wind Module
The Wind Module provides comprehensive meteorological data. It measures wind speed and direction, ambient temperature, relative humidity, and atmospheric pressure with an ultrasonic anemometer. It has a wind speed measurement range of 0 to 60 m/s (resolution 0.01 m/s) and a direction range of 0 to 360 degrees (resolution 0.1 degrees), with a typical accuracy of ± 2% for speed and ± 3° for direction in wind tunnel tests.
The information it provides offers valuable insights into the origins and movement patterns of air pollution, improving source attribution and air quality modeling.
A key feature of the Wind Module is its integration with the Clarity Dashboard, where it powers wind and pollution rose visualizations to aid in analytics and source attribution.
Where wind and pollution roses show up in the Dashboard
Wind/pollution roses live on the Historical Data page (Air quality → Historical Data, route /historical-data). There are two ways to see them:
- As a map overlay. In the Historical data control card on the left, turn on the Wind Roses toggle (it sits in the footer row alongside Show Raw and Data Cleanup). When it's on, every selected monitoring location that has wind data renders a rose directly on top of its map marker. The card's hint reads: "Wind roses will overlay on the map for selected monitoring locations that have wind data."
- As a full chart. Select one or more locations on the map (click their markers), open the advanced chart row (use the expand control on the compact chart), and pick the Wind Rose tab from the left-hand tab rail. The chart plots measurements binned by wind direction, with a "Learn more" link explaining how to read a wind rose. If none of the selected locations report wind data, the Dashboard shows a one-time "No wind measurements found" notice with a link to learn more about wind modules.
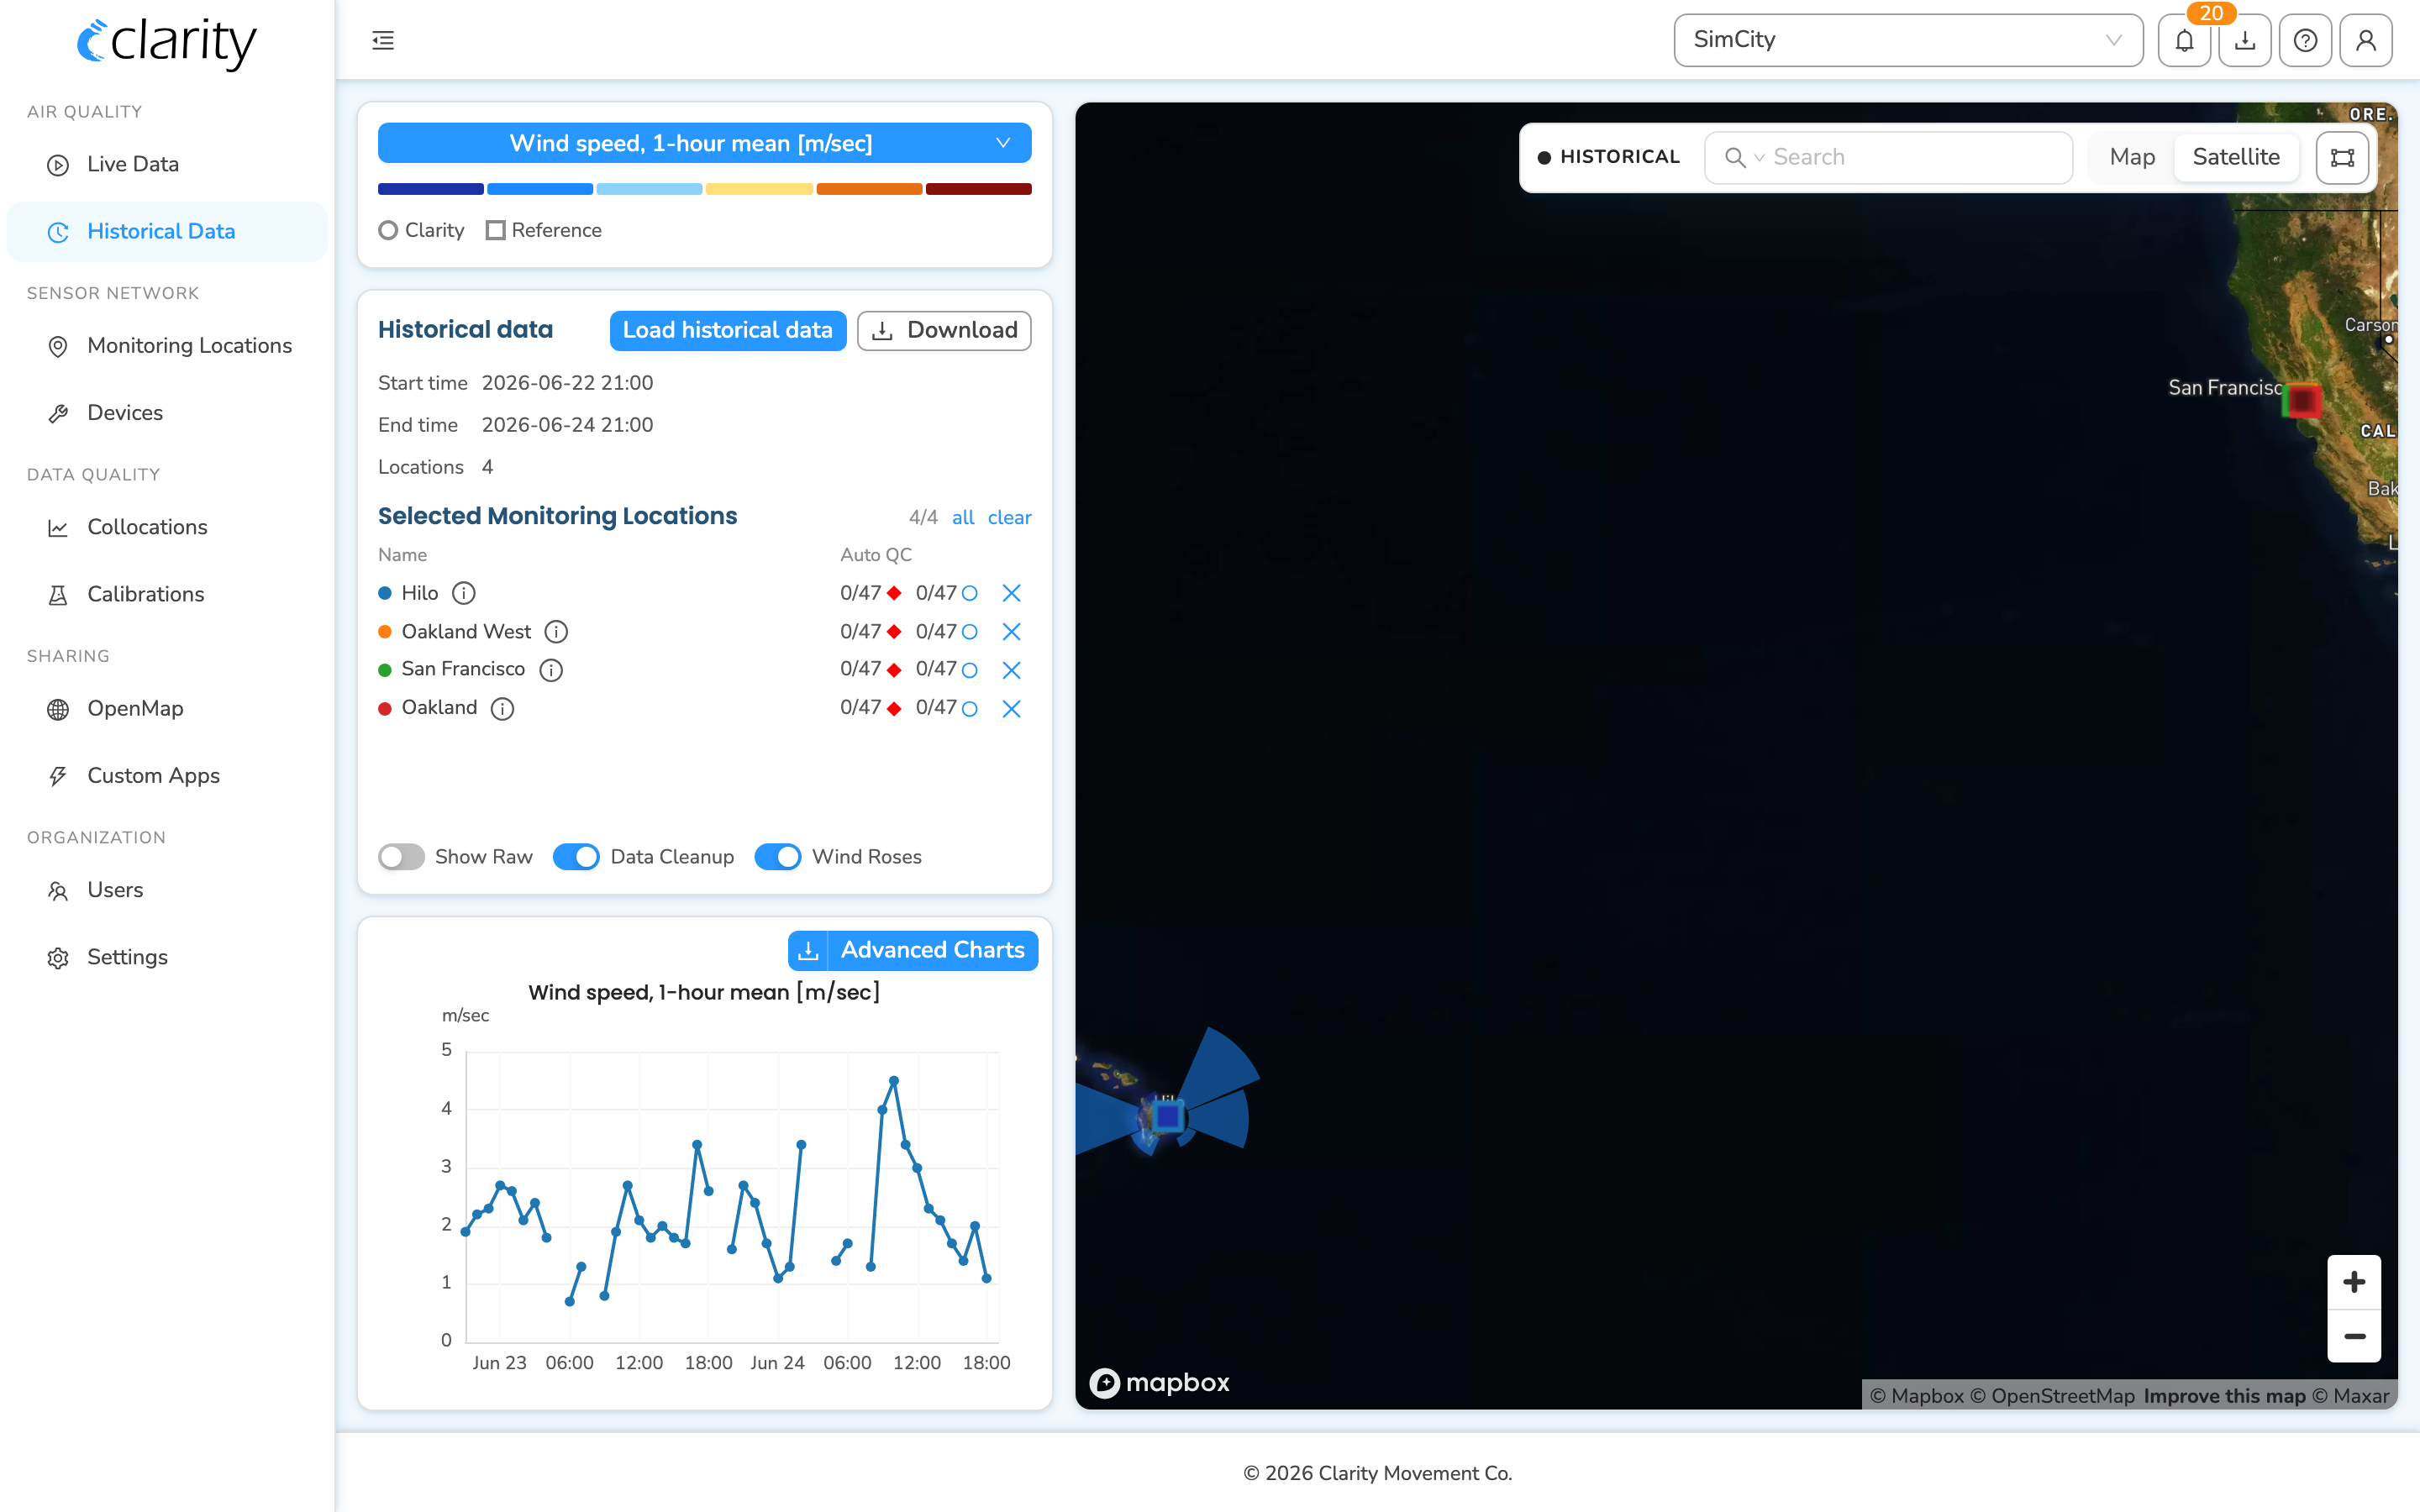
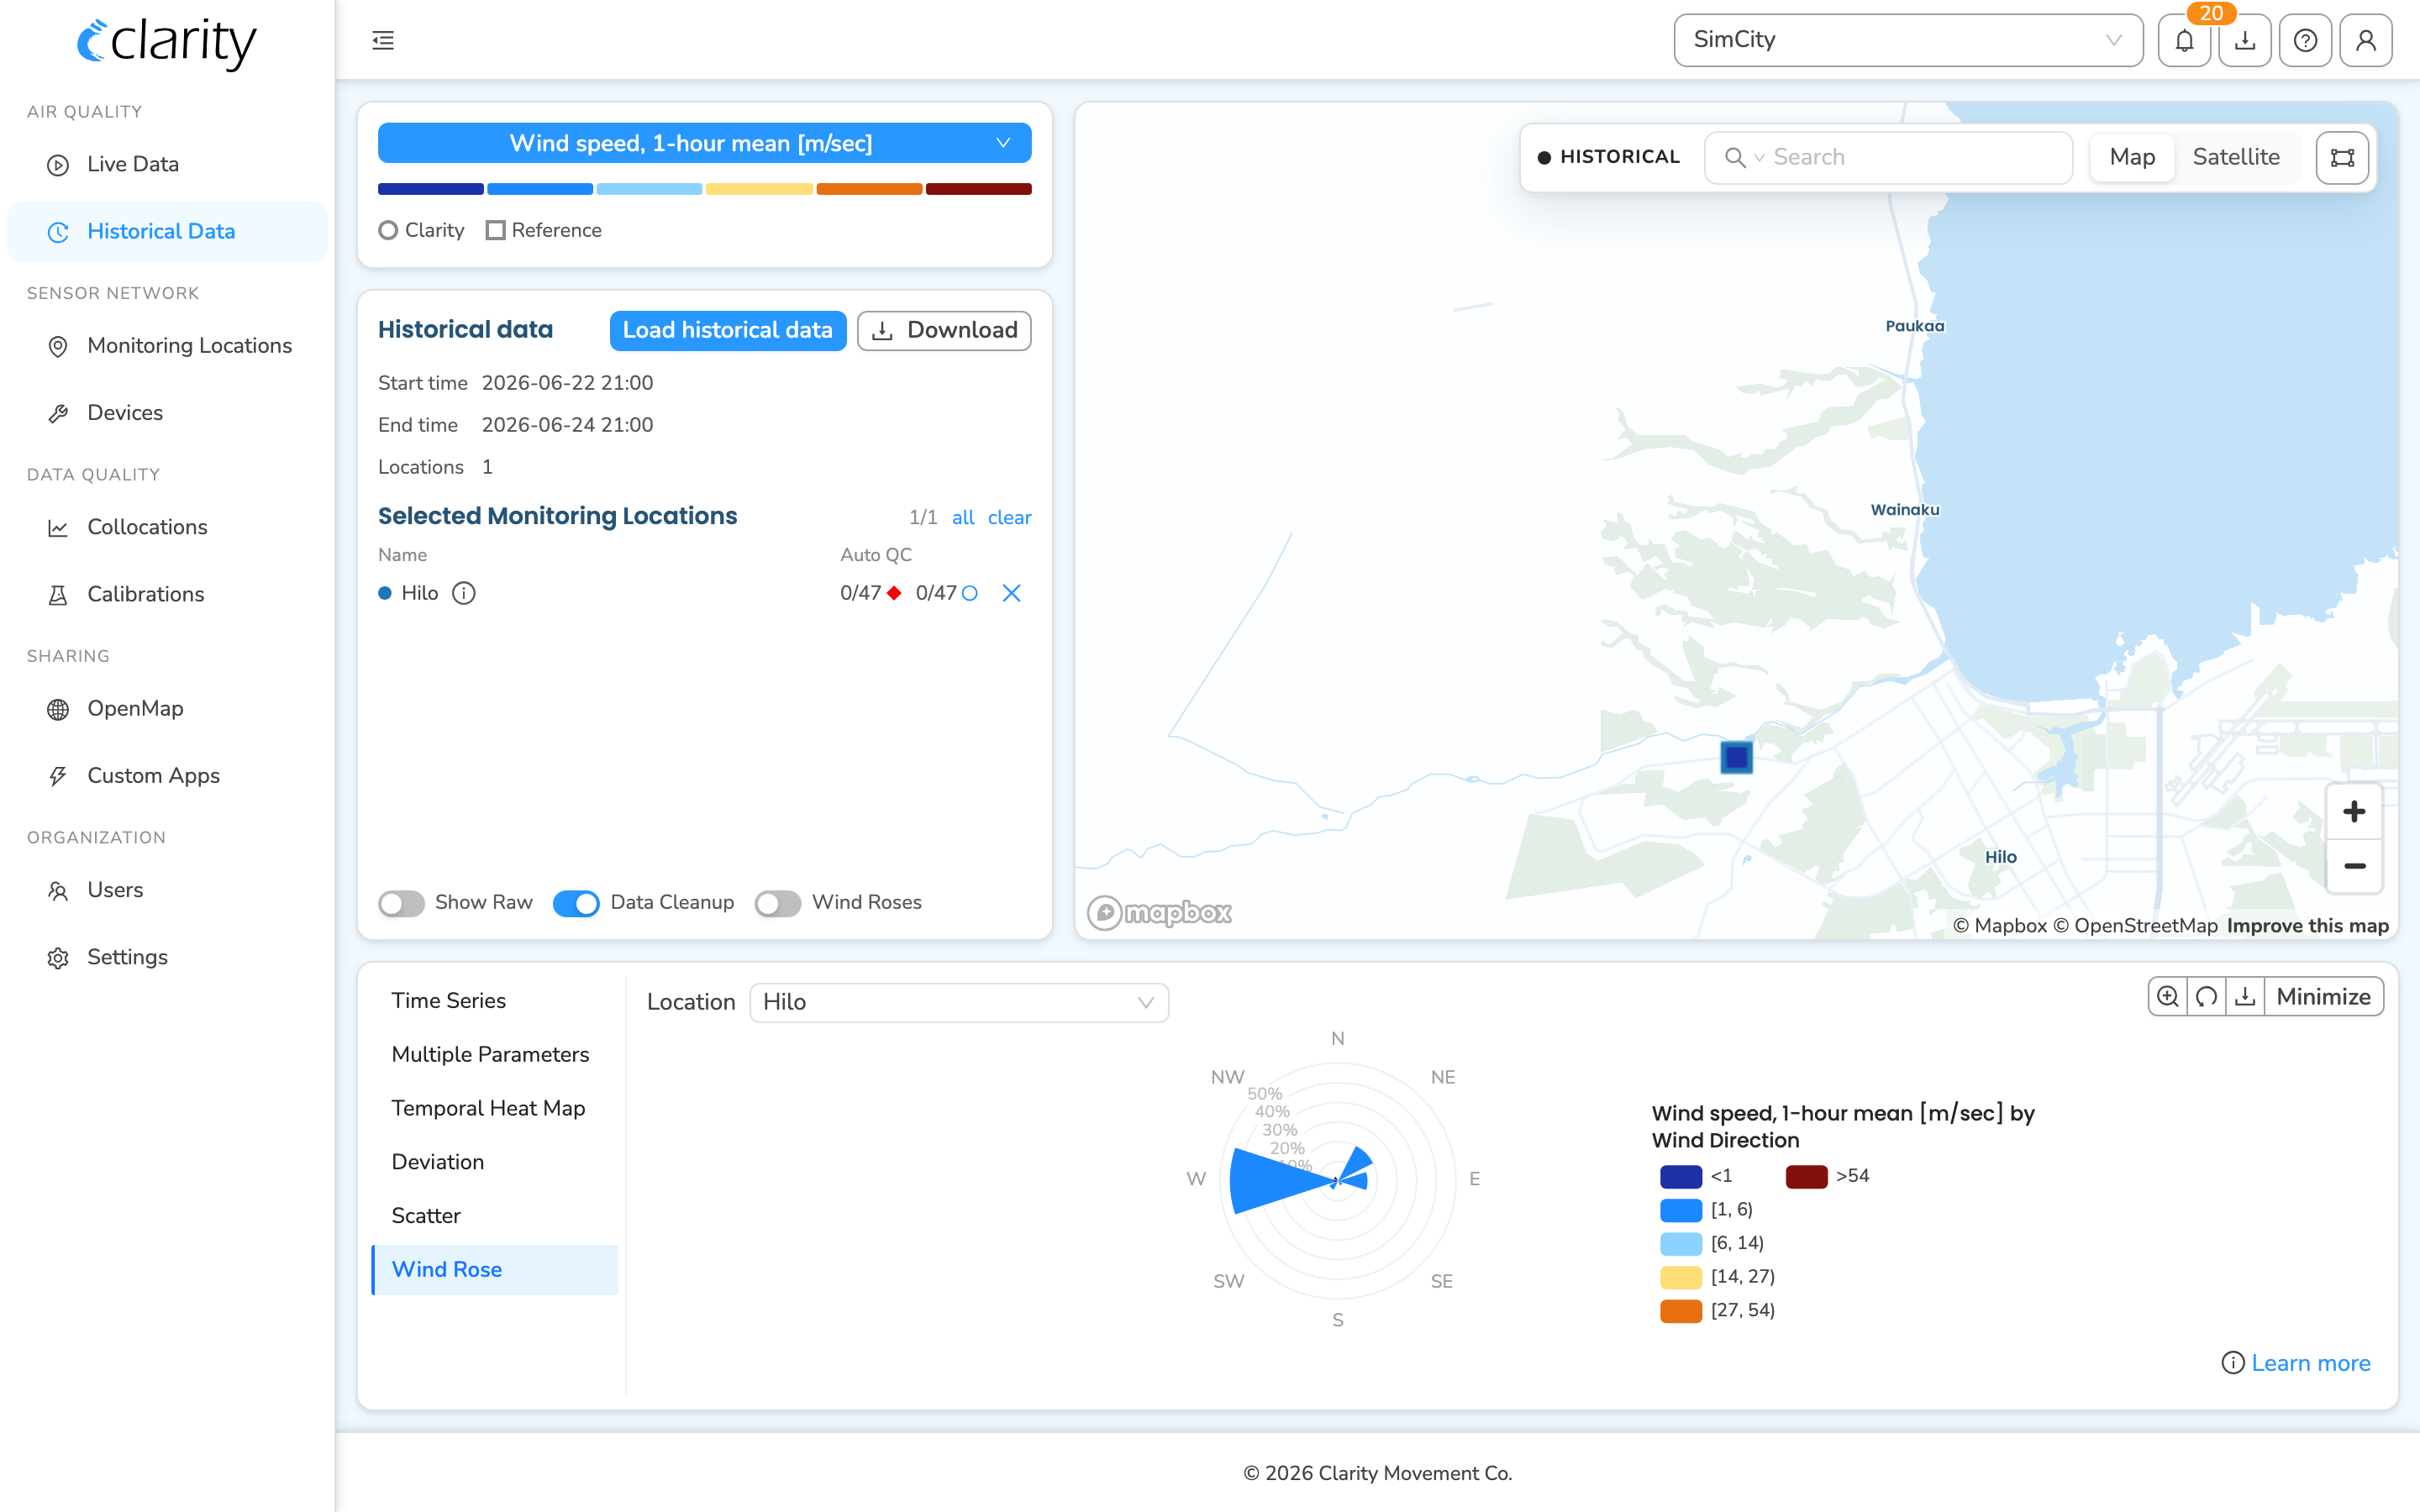
Wind and pollution roses on the Clarity Dashboard
The module is designed for easy installation and operates as a plug-and-play solution. It draws power from the native solar panel of its companion Node-S device, eliminating the need for separate power sources and simplifying deployment in various environments.
By incorporating the Wind Module into an existing Clarity Node-S network, you can significantly improve your air quality monitoring and analysis capabilities. The additional meteorological data it provides allows for more comprehensive and accurate air quality assessments, enabling better-informed decisions.
Ozone Module
The Clarity Ozone Module is an advanced air quality monitoring device designed for accurate measurement of ambient ozone concentrations. It employs the well-established ultraviolet light absorption method at 254 nm, detecting ozone levels from a few parts-per-billion (ppb) up to 100 parts-per-million (ppm), making it versatile for a wide range of monitoring applications.
A key advantage of the Clarity Ozone Module is its use of technology recognized by the U.S. EPA as a Federal Equivalent Method (FEM): EQOA-0914-218, when operated according to standard protocols, ensuring its suitability for precise monitoring (R² > 0.9, RMSE < 4 ppb) in areas facing ozone attainment challenges. As ozone is a secondary pollutant with relatively consistent distribution over short distances, this module's high accuracy and reliable data output make it preferable over lower-cost, lower-accuracy solutions.
Developed in collaboration with 2B Technologies, a leader in ozone monitoring, the Clarity Ozone Module integrates seamlessly into Clarity's sensor networks, enhancing their capability to track this critical pollutant. Due to its higher power requirements, it cannot be powered by the Node-S onboard solar panel and battery. Instead, it can be operated by connecting the Node-S to its power adapter or by using the Clarity External Power System.
Black Carbon Module
The Clarity Black Carbon Module, developed in partnership with AethLabs, is an advanced air quality monitoring device focused on measuring black carbon — a particularly harmful component of particulate matter with serious implications for human health, agricultural productivity, and climate change.
Technically, the Black Carbon Module is a real-time, 5-wavelength (880 nm, 625 nm, 528 nm, 470 nm, and 375 nm) UV-IR aethalometer. It offers a measurement range of 0–1 mg/m³ with a resolution of 1 ng/m³ and a high accuracy comparable to the well-regarded Magee Scientific AE33 (R² > 0.9, RMSE < 200 ng/m³). By measuring at multiple wavelengths, it can determine total black carbon concentration and differentiate black carbon from biomass versus fossil-fuel burning sources. This source apportionment feature lets you identify the specific sources of black carbon and particulate matter at a given location, such as distinguishing between traffic emissions and forest fires. These insights are accessible through the Clarity Dashboard on the Historical Data page.
Where Black Carbon source apportionment shows up in the Dashboard
Source apportionment is a chart on the Historical Data page (Air quality → Historical Data, route /historical-data). To reach it:
-
Open Air quality → Historical Data.
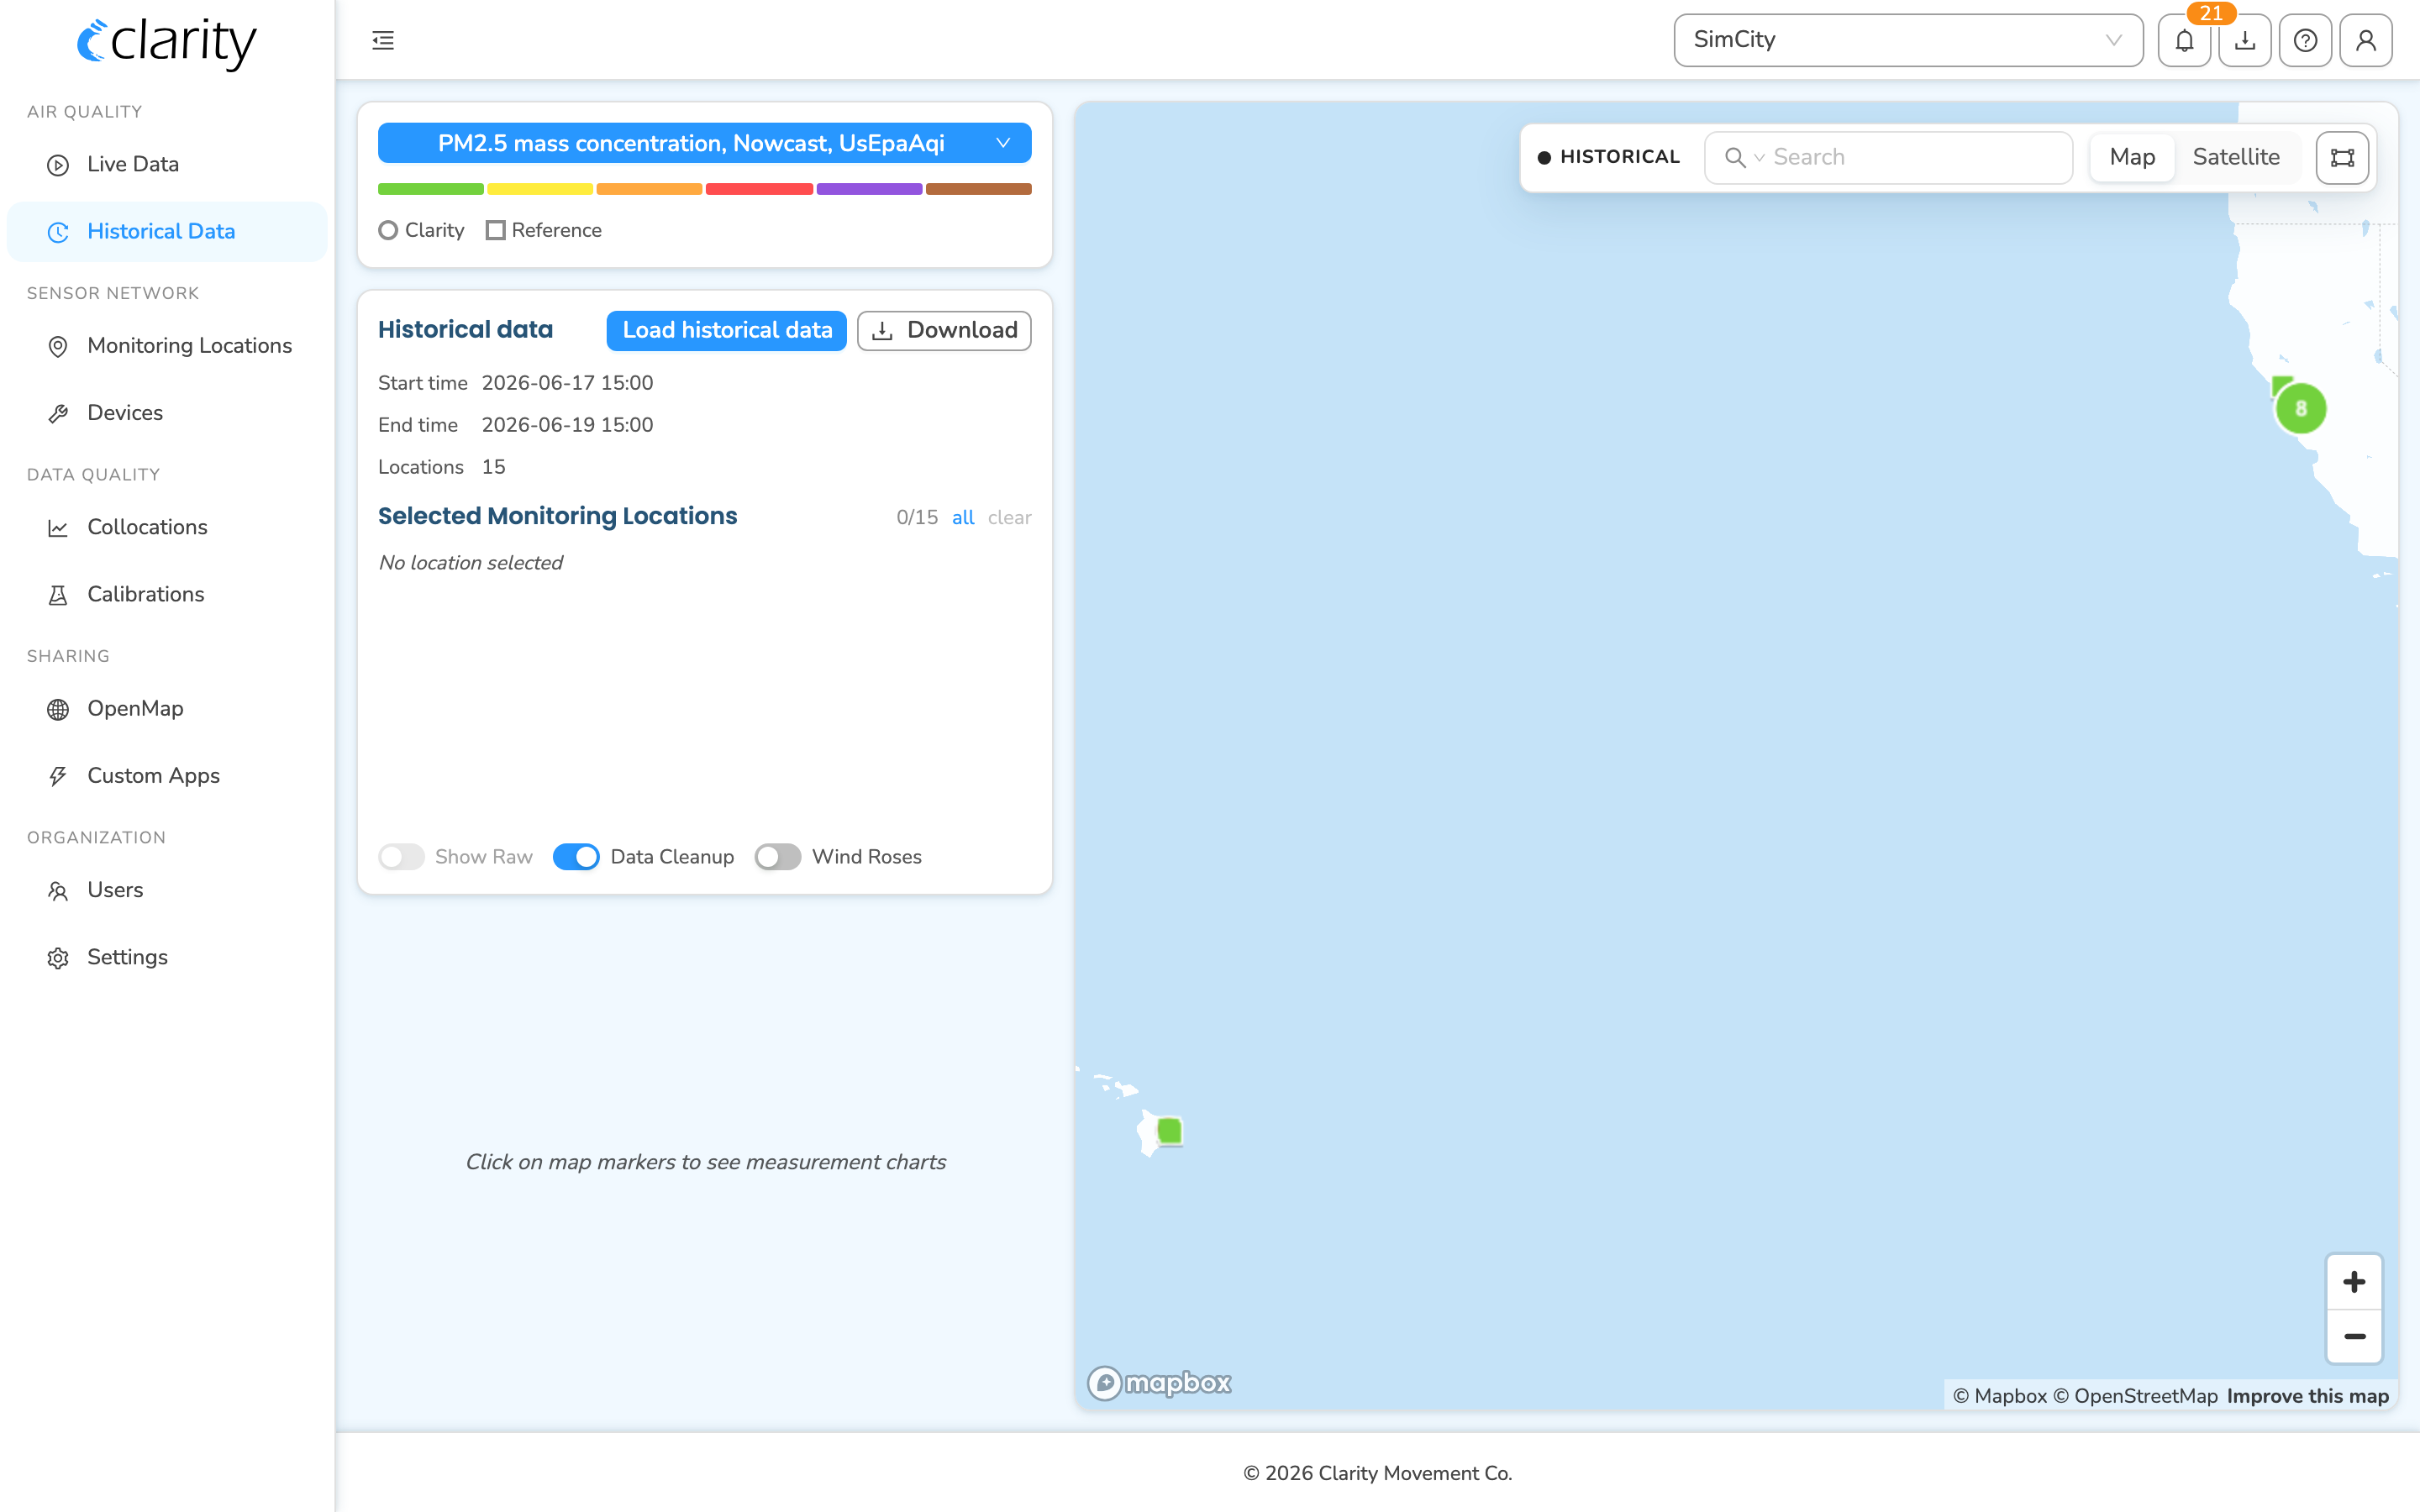
-
Click the blue metric pill at the top of the left control card (in the screenshot above it reads "PM2.5 mass concentration, Nowcast, UsEpaAqi") to open the metric picker, and choose a Black Carbon (sources) metric — the one that carries the biomass / fossil-fuel breakdown.
-
Select one or more Black Carbon-capable locations on the map (click their markers), then click Load historical data to fetch the measurements for the loaded window.
-
Open the advanced chart row and pick the Source Apportionment tab from the left-hand tab rail. This tab only appears when a Black Carbon sources metric is selected.
The Source Apportionment chart stacks Biomass and Fossil fuel as bars (they sum to the total) and traces All sources as a reference line on top. If more than one location is selected, a Location picker at the top of the chart lets you switch between them. If a selected location has no black carbon source data, the chart shows "No black carbon source data for this location."
Real-time black carbon source apportionment between fossil fuels and biomass on the Dashboard
Designed for outdoor environments, the module can be installed on street poles or fence lines, making it ideal for long-term monitoring campaigns. Its Filter Tape Cartridge system ensures minimal maintenance and supports extended multi-month deployments with infrequent site visits.
The Black Carbon Module works in tandem with the Clarity Node-S device. Due to its higher power requirements, it cannot be powered by the Node-S onboard solar panel and battery. Instead, it can be operated by connecting the Node-S to its power adapter or by using the Clarity External Power System. A Wind Module can also be added to enhance source-apportionment capabilities.
Clarity Node-S with Black Carbon Module deployed using the Clarity External Power System
Integrating the Clarity Black Carbon Module into a Clarity sensor network supports continuous monitoring and source analysis of black carbon and particulate matter, enabling organizations to answer advanced environmental questions.
Multi-Gas Module
The Clarity Multi-Gas Module is designed to detect a configurable set of gases depending on your project needs. Common options include nitrogen dioxide (NO₂), carbon monoxide (CO), and ozone (O₃). This allows for targeted monitoring of pollutants from traffic, industry, and combustion sources.
Designed for effortless deployment, the Multi-Gas Module features a weatherproof, UV-resistant enclosure and modular mounting for quick installation on both vertical and horizontal poles. With Clarity's plug-and-play add-on module design, the Multi-Gas Module leverages the solar-powered operation and built-in cellular connectivity of the Node-S — even when paired with the Wind Module.
The Multi-Gas Module enhances Clarity deployments by adding gaseous pollutant data to existing PM or black carbon measurements. When paired with the Node-S, it helps build a fuller picture of air quality by capturing both particle- and gas-phase pollutants, enabling better source attribution and response planning.
What's next
- Check Node-S and module compatibility.
- Deploy your Clarity Node-S.
- Keep your Node-S maintained.
- Learn the lifetime of the Clarity Node-S.
Was this article helpful?
Yes, thanks! / Not really
Still need a hand? Email us at support@clarity.io or create a support ticket, and our team will get back to you.