Clarity Cloud software overview
Clarity Cloud is the software suite that works alongside your Clarity air quality monitoring hardware. Behind the scenes it acts as an integrated data pipeline — calibrating and quality-checking sensor data, storing it securely, and making it consistently available to you. For your day-to-day work it gives you one place to manage your sensor network, organize and visualize your monitoring data, and share air quality insights with stakeholders or the public.
The primary components of Clarity Cloud are:
- Clarity Dashboard — an intuitive, real-time web app where you access and interpret monitoring data, manage your sensor network, review device status, and control who can see your data.
- Clarity API — a REST API for programmatic access, so you can integrate Clarity data with your own systems or run advanced analyses in R, Python, GIS tools, and more.
- Clarity OpenMap — a public, interactive map for sharing air quality data with your community.
Clarity emphasizes data ownership and security: your organization is the exclusive owner of its data. Clarity does not share your data with third parties without your consent, and you have full access to all raw data from your Node-S devices and Modules — nothing is hidden.
Clarity Dashboard
Clarity Dashboard is a password-protected web application that simplifies air quality data visualization and sensor-network management. After your organization is set up, members create accounts to sign in. The first step is configuring your Node-S devices and modules alongside field deployment. Once deployed, devices stream air quality measurements and telemetry over the cellular network, and that data appears on the Dashboard.
Finding your way around
The Dashboard has a grouped left sidebar. The groups (and the pages in each) are:
- Air quality — Live Data, Historical Data
- Sensor network — Monitoring Locations, Devices
- Data quality — Collocations, Calibrations
- Sharing — OpenMap, Custom Apps
- Organization — Users, Settings (and Billing, when your org has self-service billing enabled)
Which entries you see depends on your role. Guests see only Live Data and Historical Data; most management pages require an org member role, and a few (Users, Settings, Billing) require org admin.
The top bar carries the org switcher, a notifications/alarm bell, a downloads (export) tray, a help link, and your account menu. Two pages — AQ Alarms and Downloads — don't have their own sidebar entries; you reach them from the top bar (the alarm bell and the download tray respectively).
The main features of the Clarity Dashboard:
Real-time data access (Live Data)
Where: Air quality → Live Data
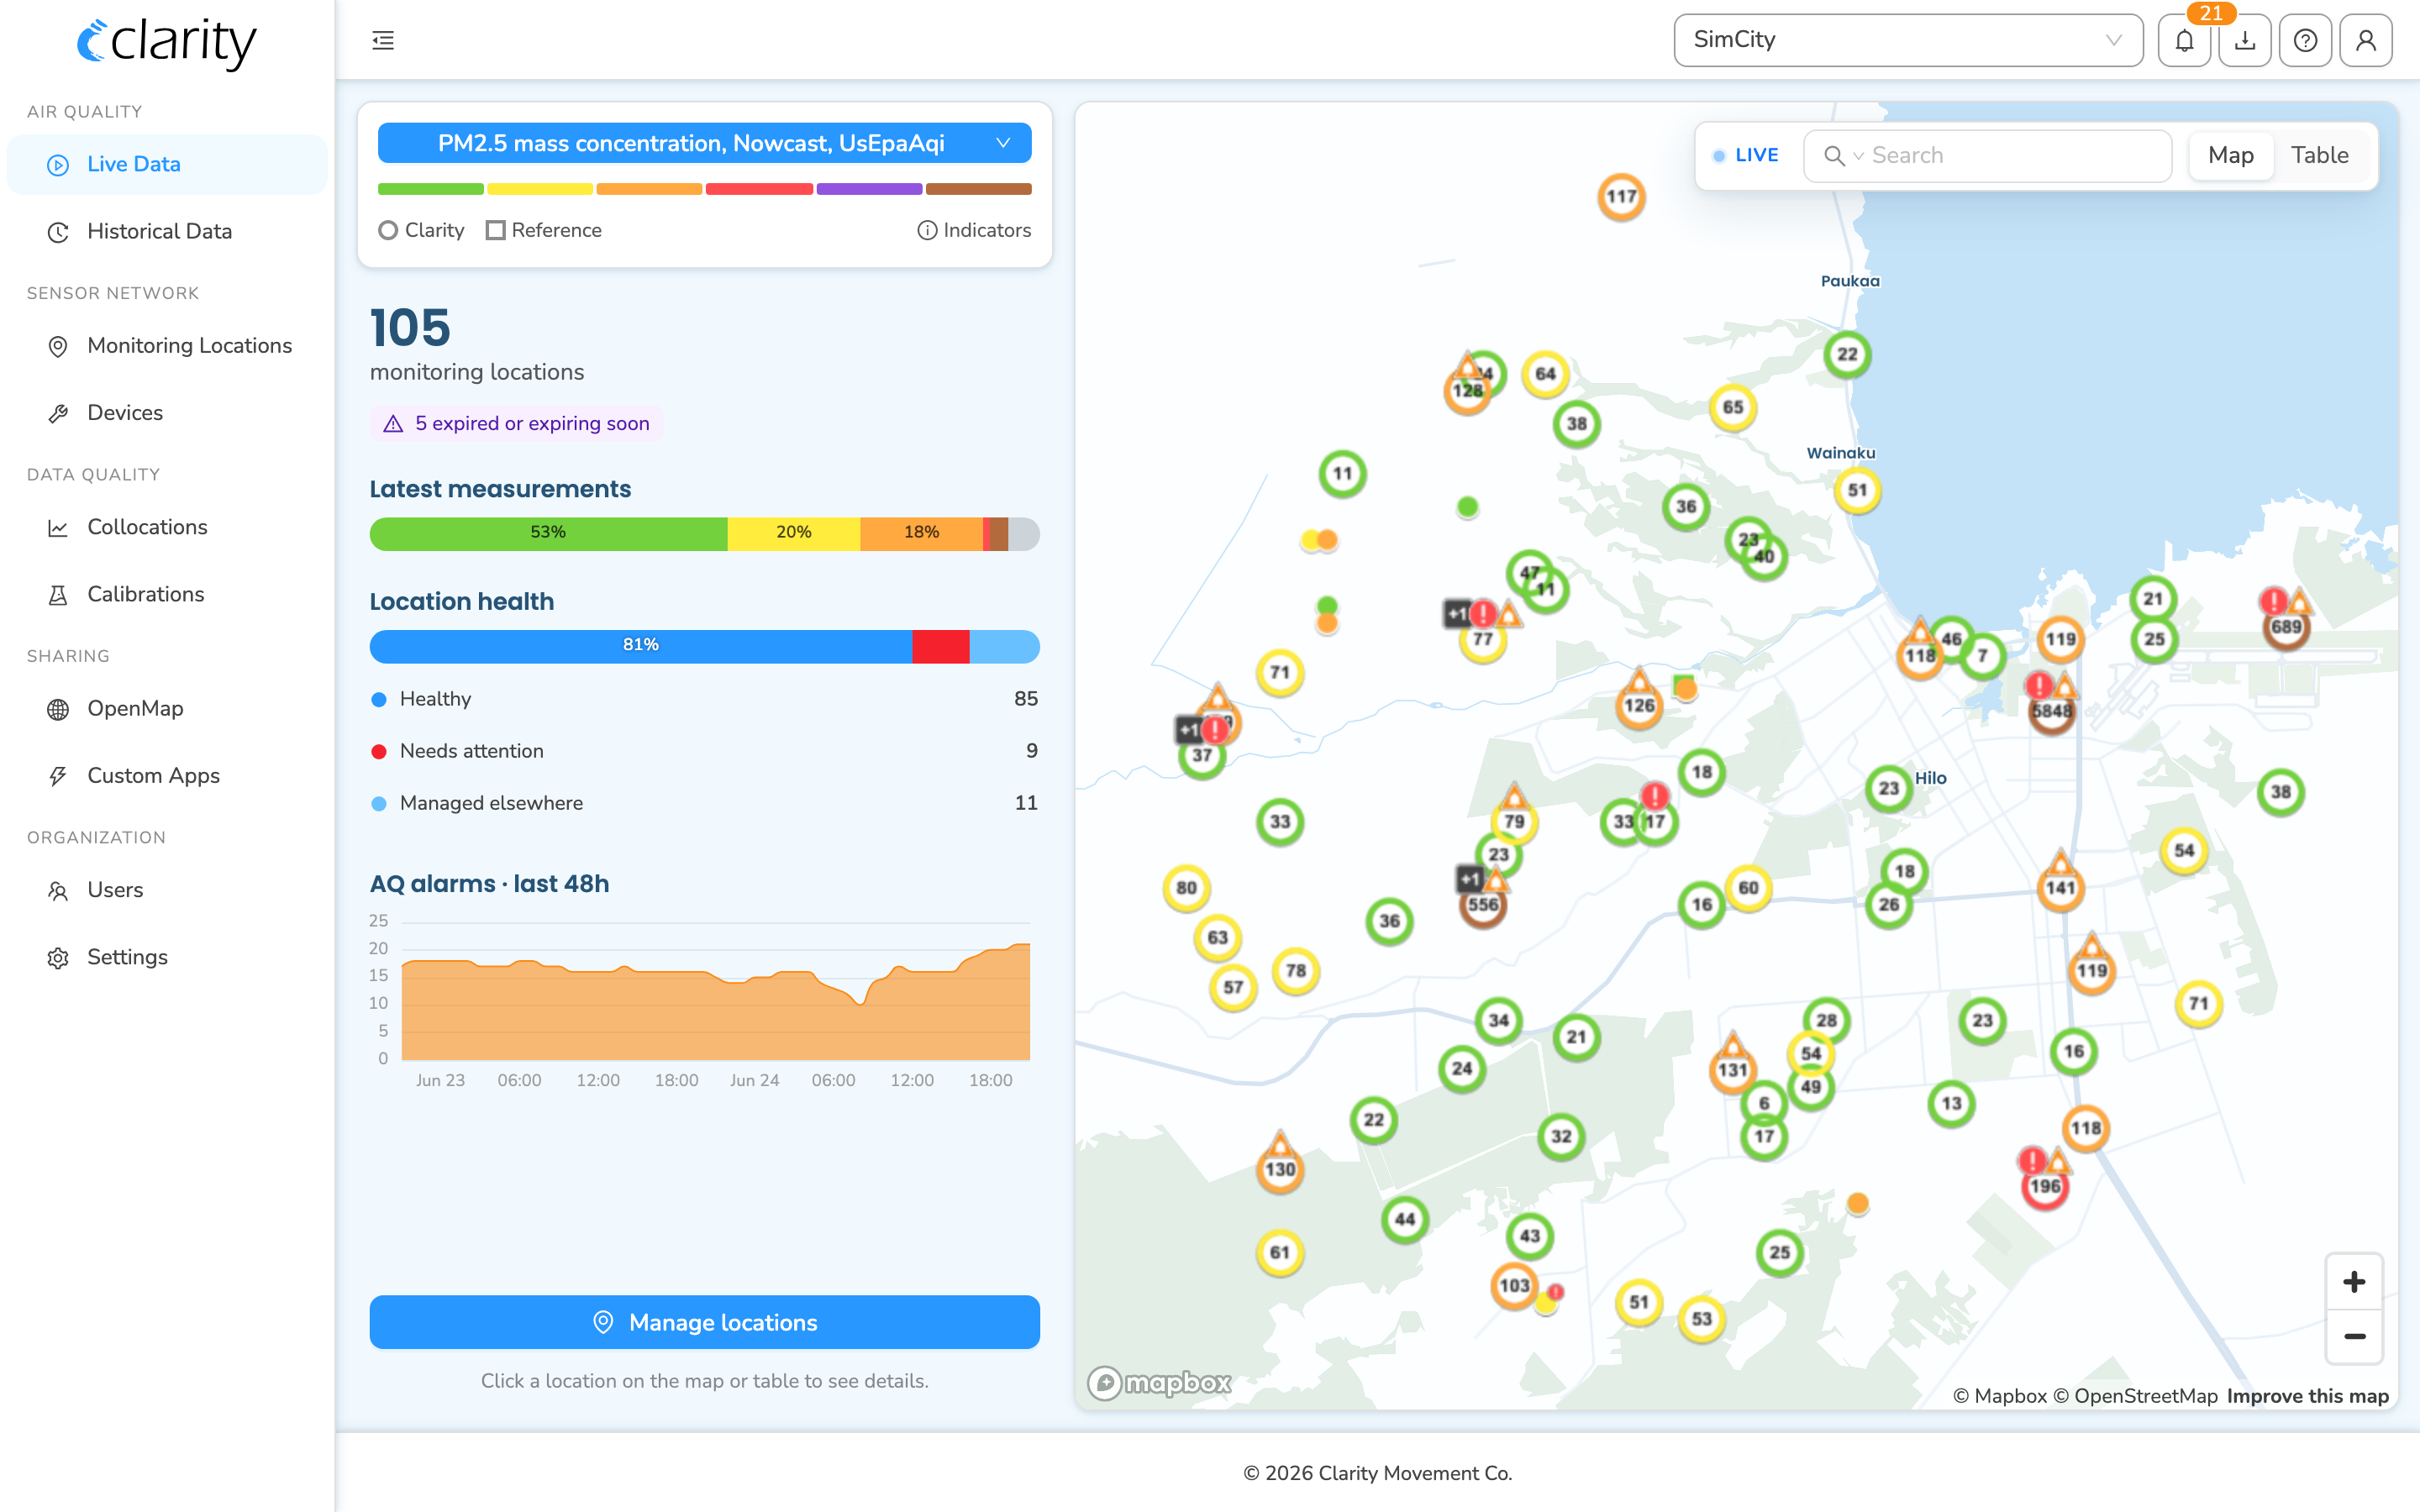
Live Data is your at-a-glance view of the whole network's most recent measurements. The right pane is a map (or a sortable Table — toggle with the control in the top-right search bar) of every monitoring location, each marker coloured by its latest valid measurement for the selected parameter. Click a marker to open its detail in the left panel; clustered markers fan out so you can pick the one you want.
The left panel summarizes the network:
- The selected parameter picker at the top (e.g. "PM2.5 mass concentration, NowCast, USEPAAQI").
- A count of monitoring locations, with a "N expired or expiring soon" warning when relevant.
- Latest measurements progress.
- Location health — broken into Healthy, Needs attention, and Managed elsewhere; click a bucket to filter the map and table to it.
- AQ alarms · last 48h — a small activity chart.
- A Manage locations button that jumps to Monitoring Locations.
Use the search box (top-right of the map) to filter by name, group, tag, or ID (datasource D…, node A…, or paired module M…).
Air quality data analysis (Historical Data)
Where: Air quality → Historical Data
Historical Data is the workspace for exploring measurements over a time window. Pick locations on the map (click markers, or drag a lasso to select several), then load a time range. Selected locations show as coloured chips and plot into the chart below.
The compact chart shows a time series; click Advanced to open the full chart workspace, which has tabs for:
- Time Series
- Multiple Parameters
- Temporal Heat Map
- Deviation
- Scatter
- Wind Rose
- Source Apportionment (only for Black Carbon "sources" metrics)
A wind rose can also be overlaid directly on the map for selected locations that have wind data. Additional visualizations are available when add-on Modules are paired, expanding your insights before any advanced offline analysis.
The view is shareable: the page mirrors your selection, time window, parameter, and open chart tab into the URL, so copying the address bar reproduces the same view for a colleague.
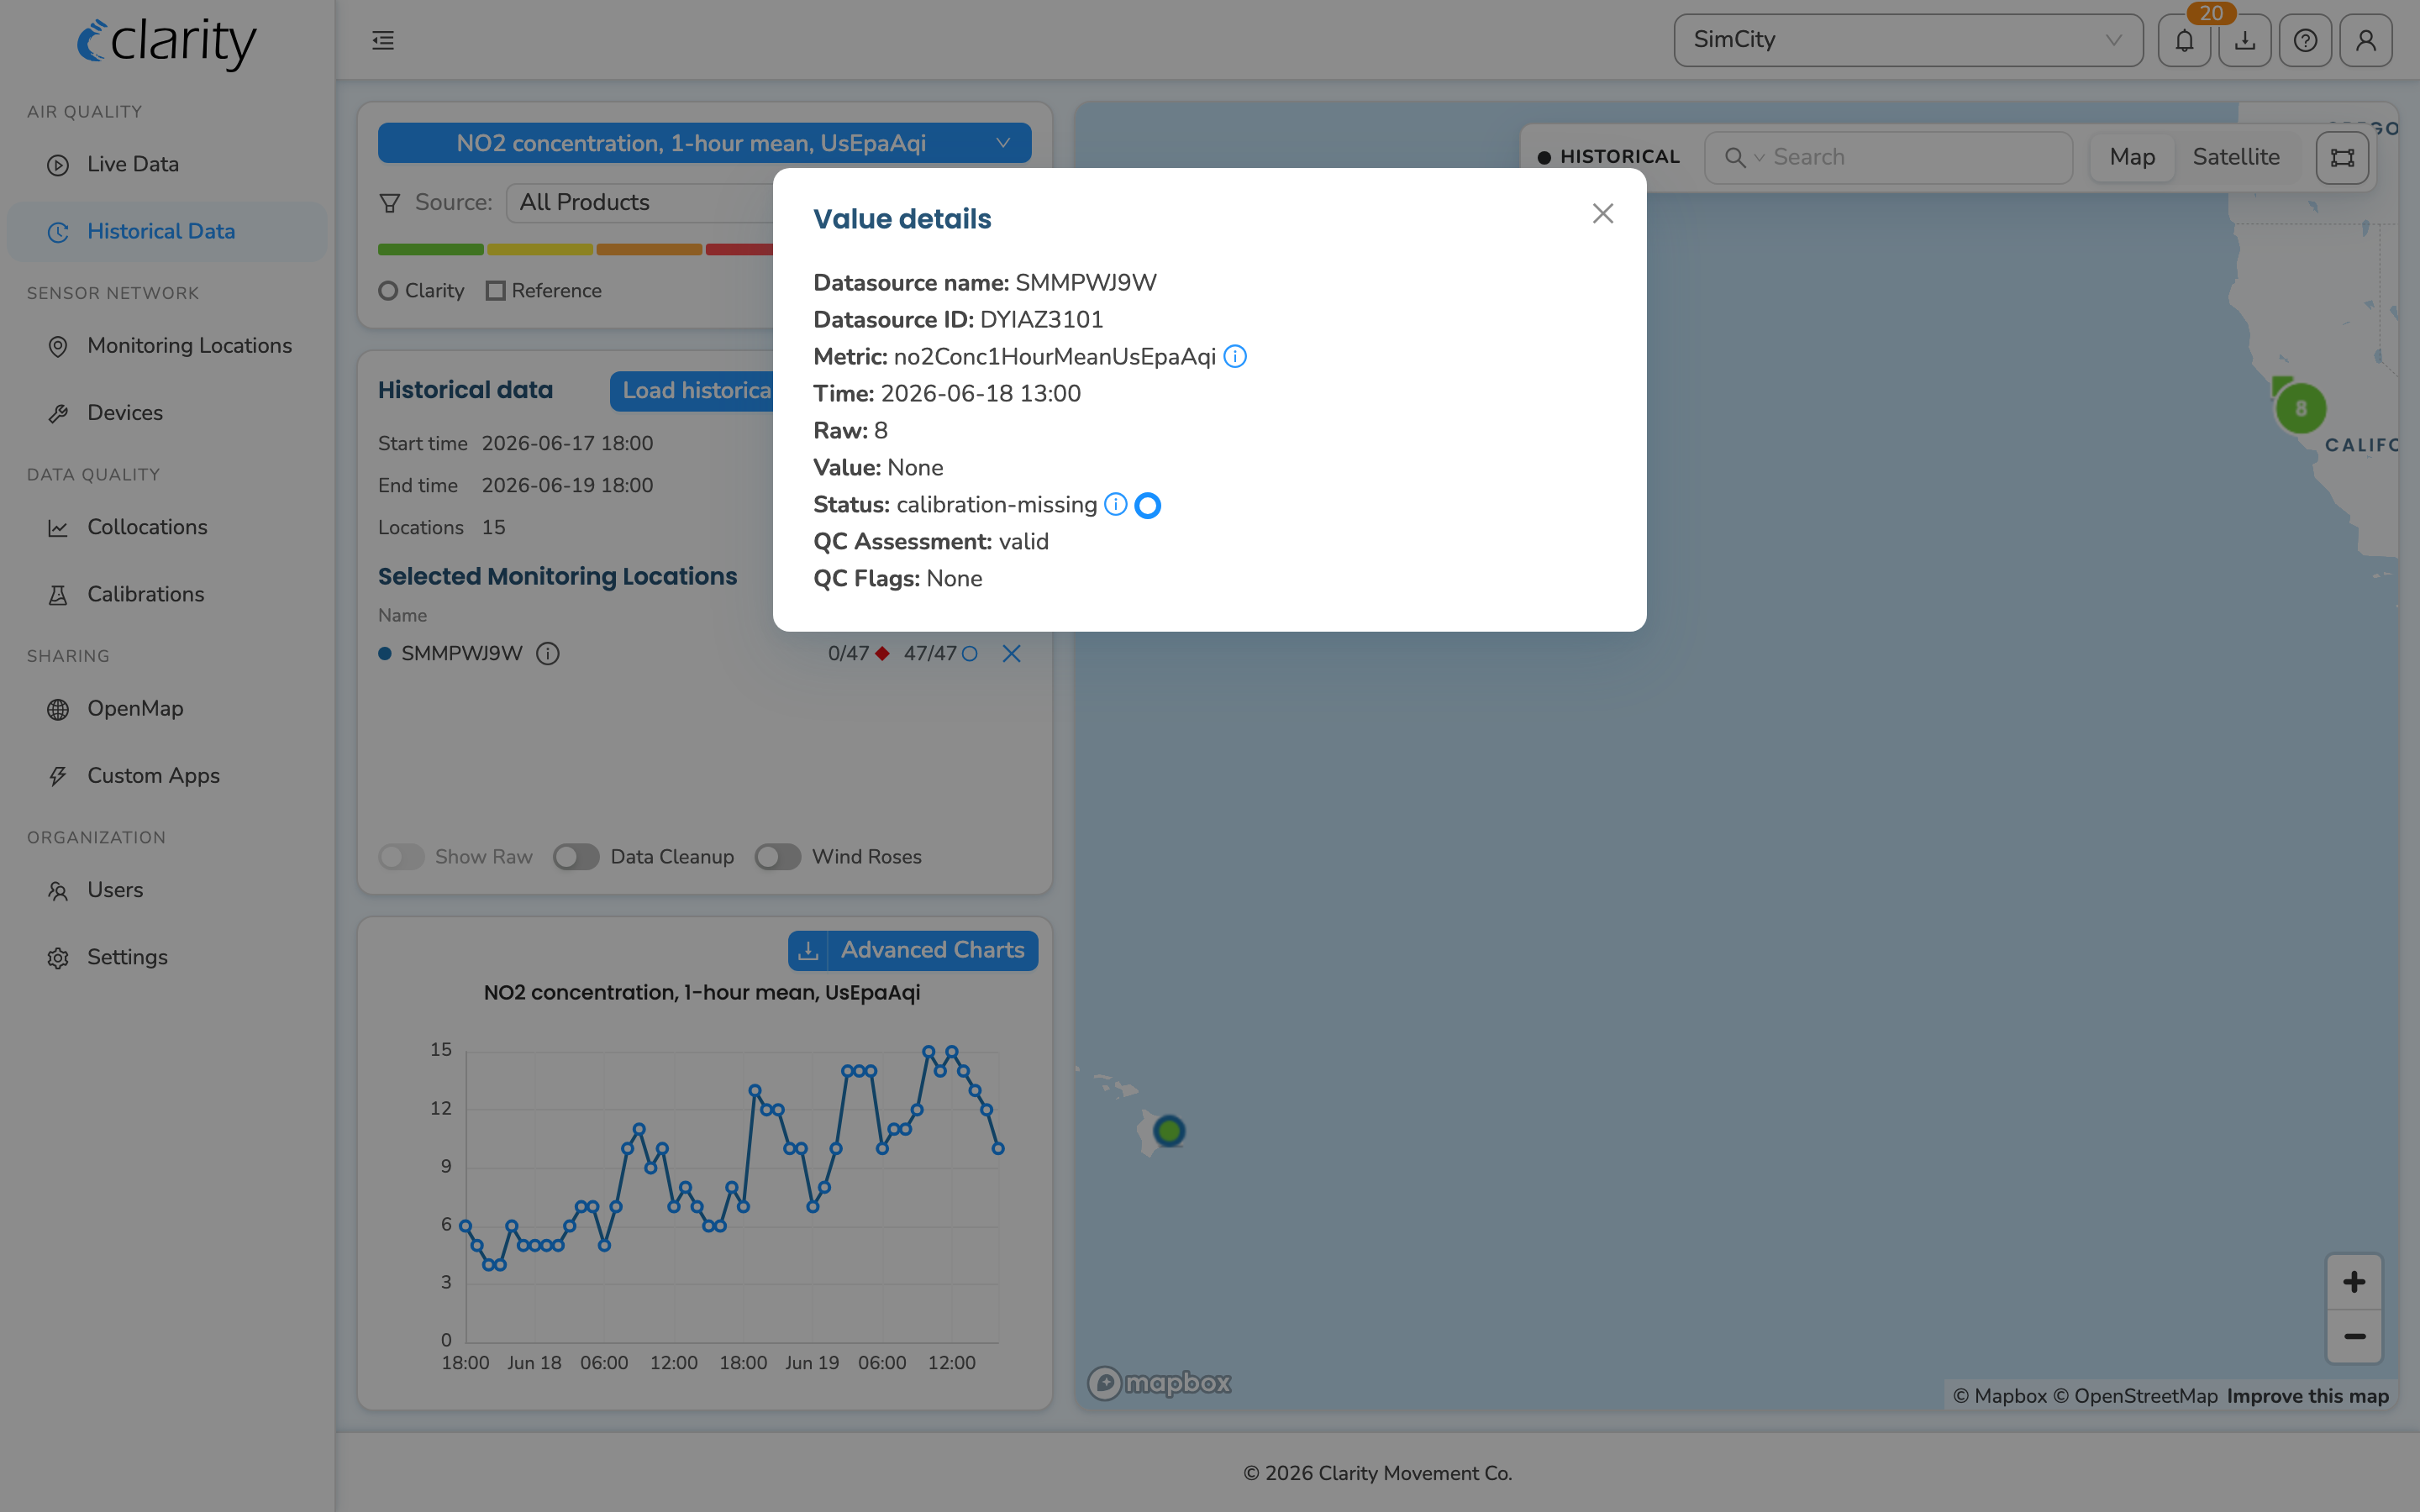
Automated quality control
Clarity automatically applies QC flags to measured values based on our understanding of air pollution, sensor technology, and known failure modes, then computes an overall QC assessment from the severity of those flags. This makes it easy to filter out invalid measurements from analyses and from public sharing. In Historical Data, clicking a data point opens its Value Details, which shows the QC assessment and the individual QC Flags for that point. (Note: the location is identified by its Monitoring Location, also referred to as a "Datasource" in the API.)
Remote device management (Devices)
Where: Sensor network → Devices
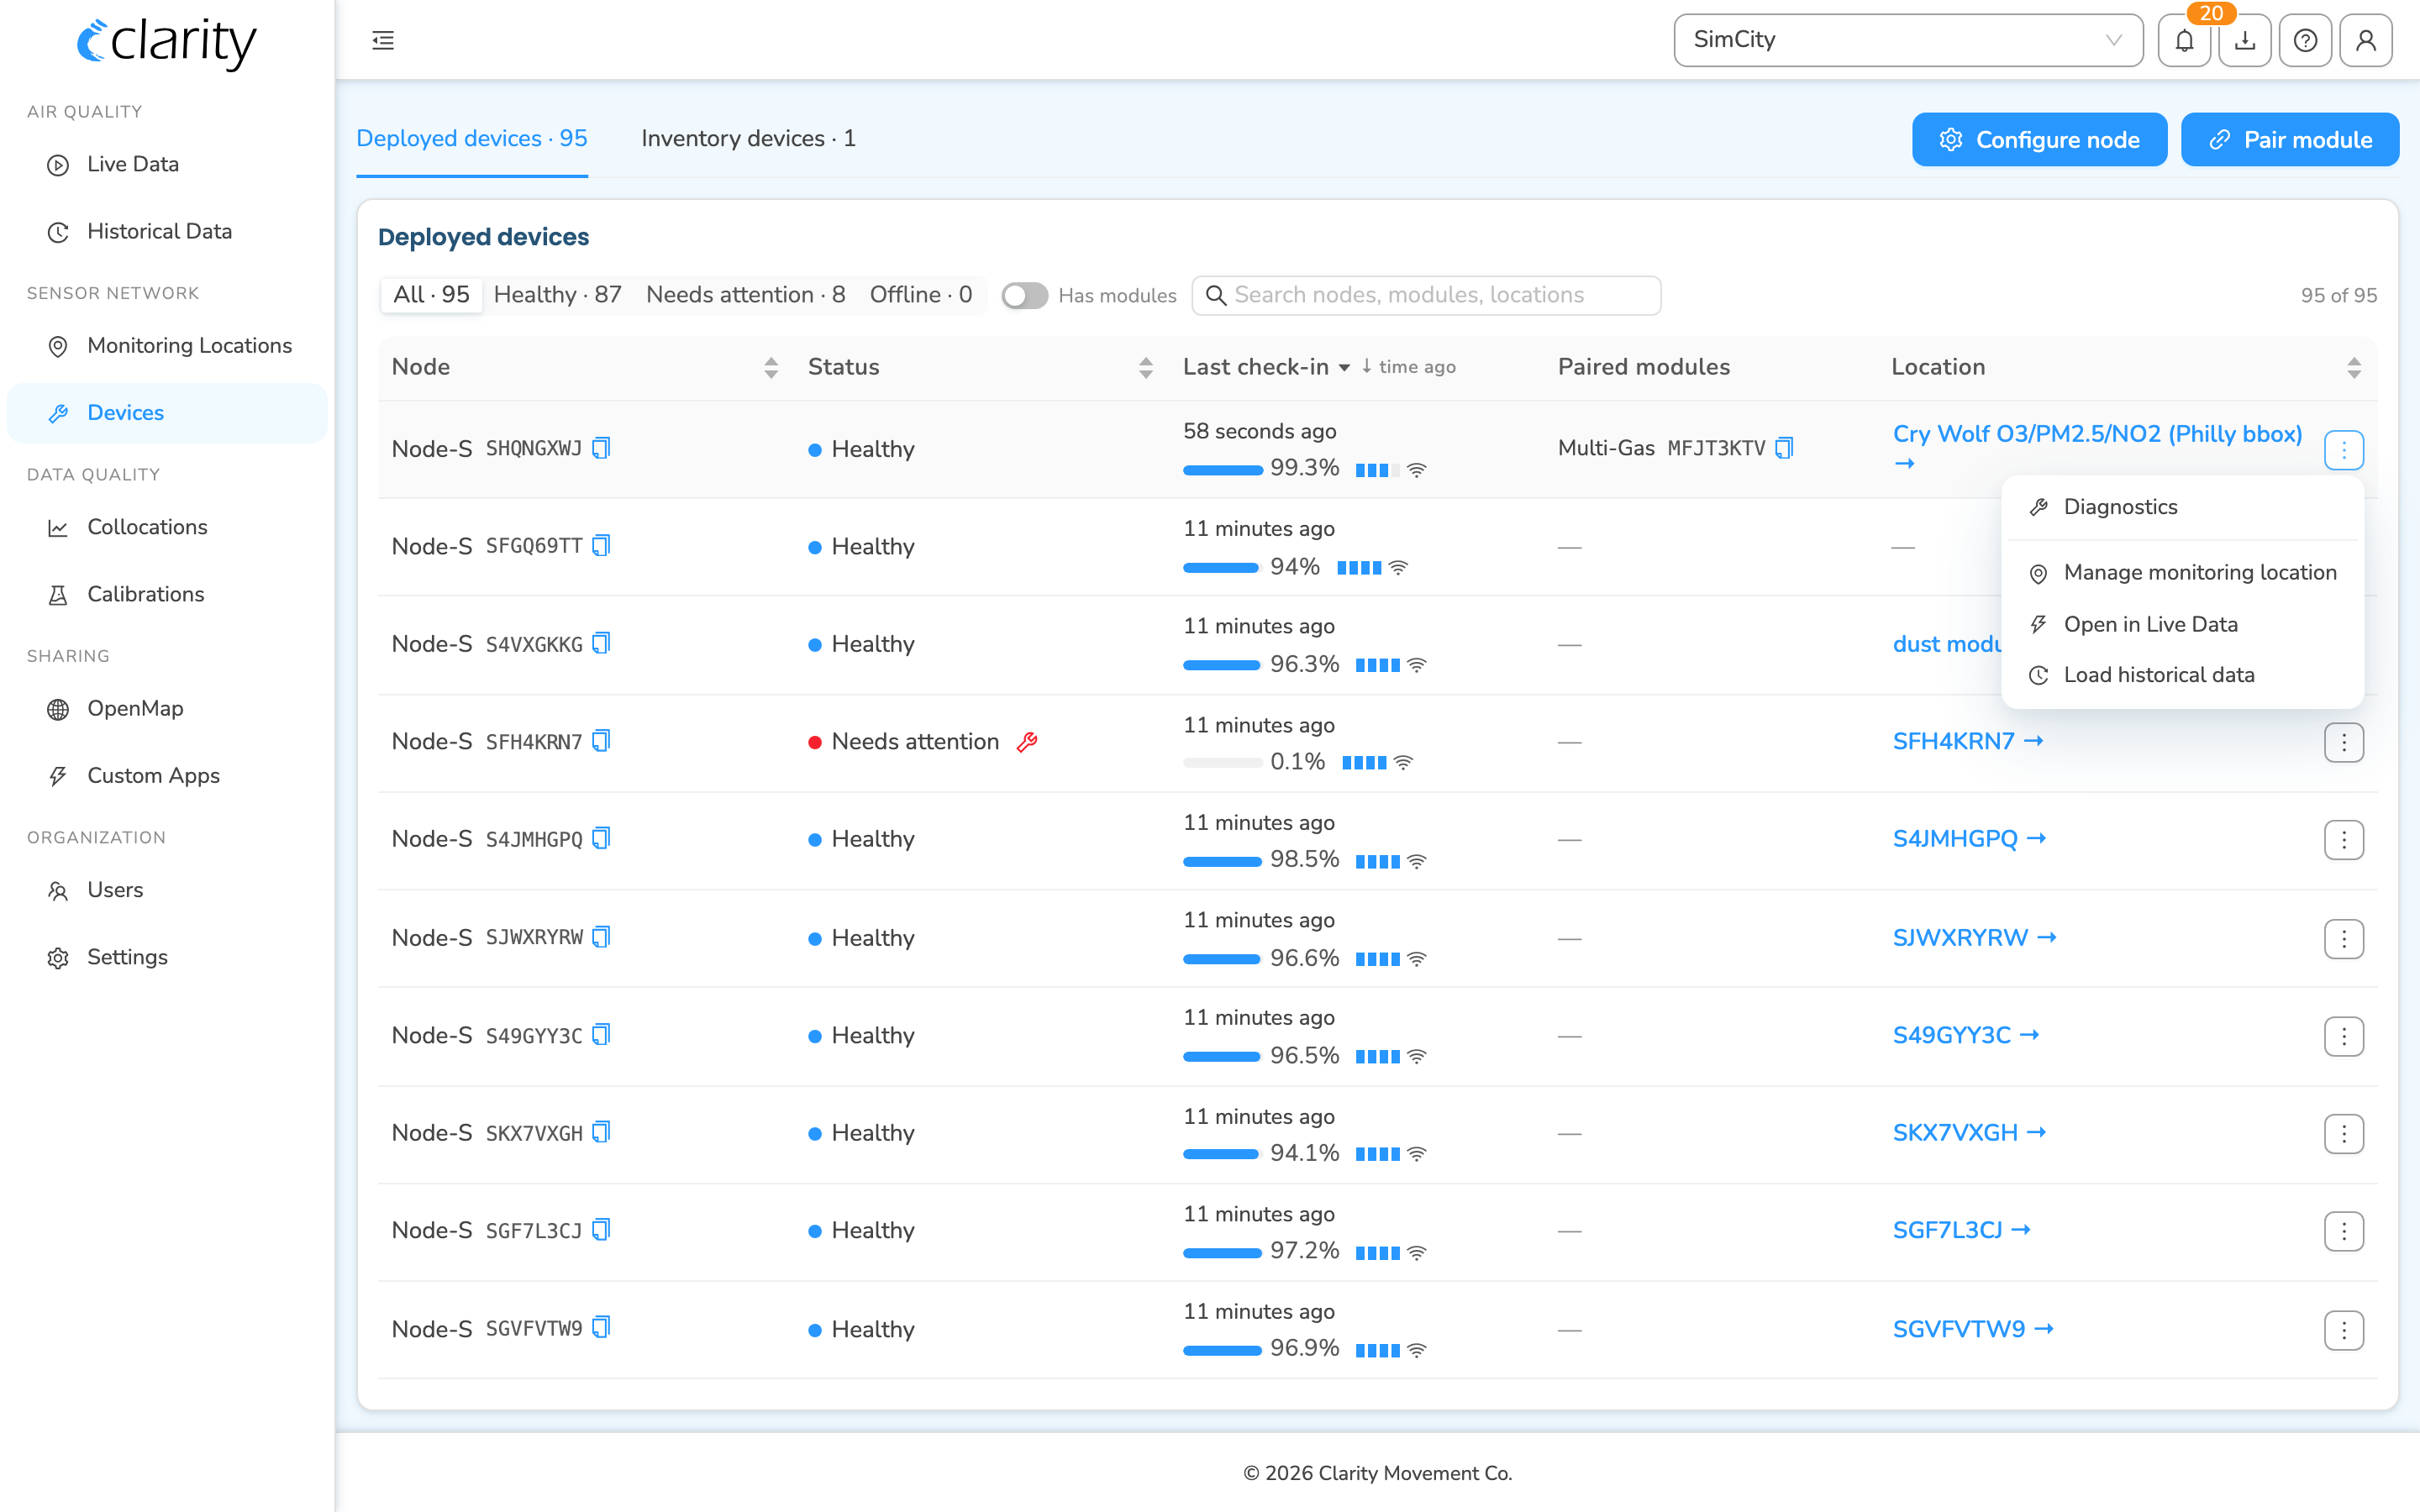
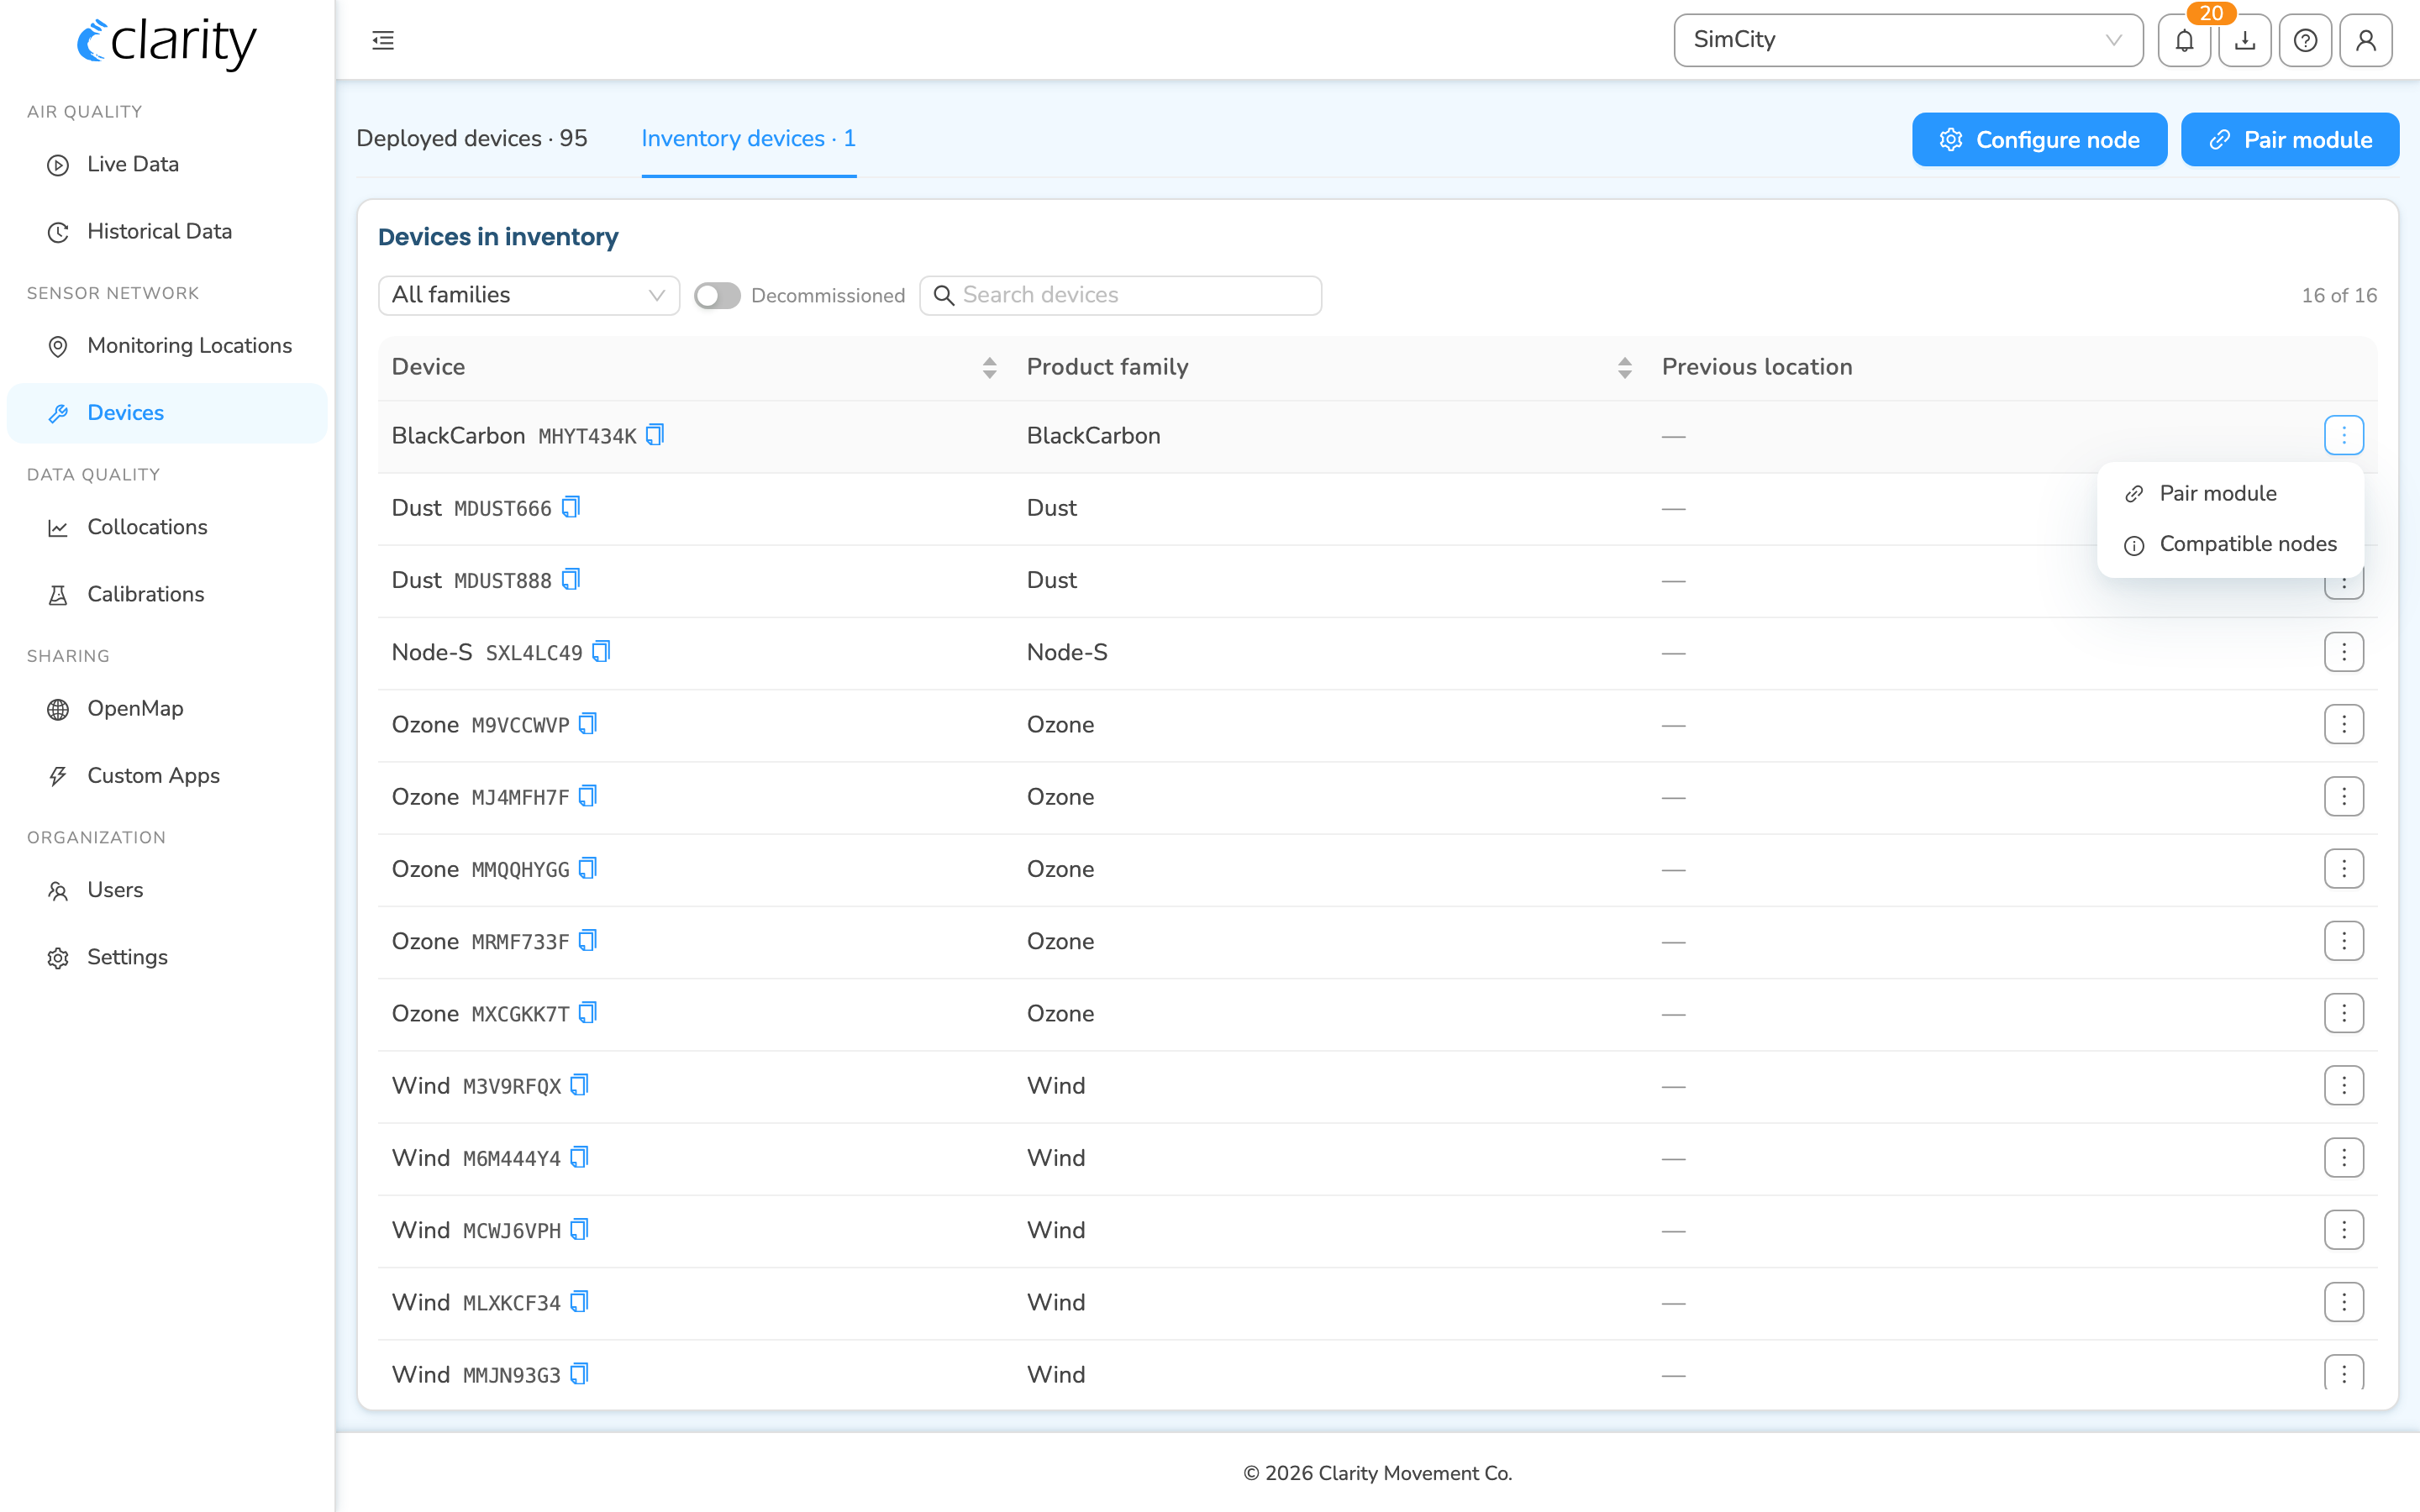
Devices is one unified page for every node and module your org owns, split into two tabs:
- Deployed devices — what's currently running. Each row shows the node, a health status (Healthy / Needs attention / Offline, or "Waiting for first reading" right after configuration), last check-in with battery and signal, any paired modules, and the location. Filter with the Healthy/Needs attention/Offline segmented control, the "Has modules" toggle, and the search box.
- Inventory devices — what's available but not deployed (purchased nodes and unpaired modules; you can also toggle in decommissioned nodes).
Two primary actions sit in the top-right of the page, on both tabs:
- Configure node → opens the node configuration wizard (
/configure-node). - Pair module → opens the module-pairing wizard (
/devices/pair-a-module).
Both buttons require an org admin or technician role; for everyone else they appear disabled with a tooltip.
Row actions on a deployed device (the ⋮ menu, also called Row actions) are focused on inspection and navigation:
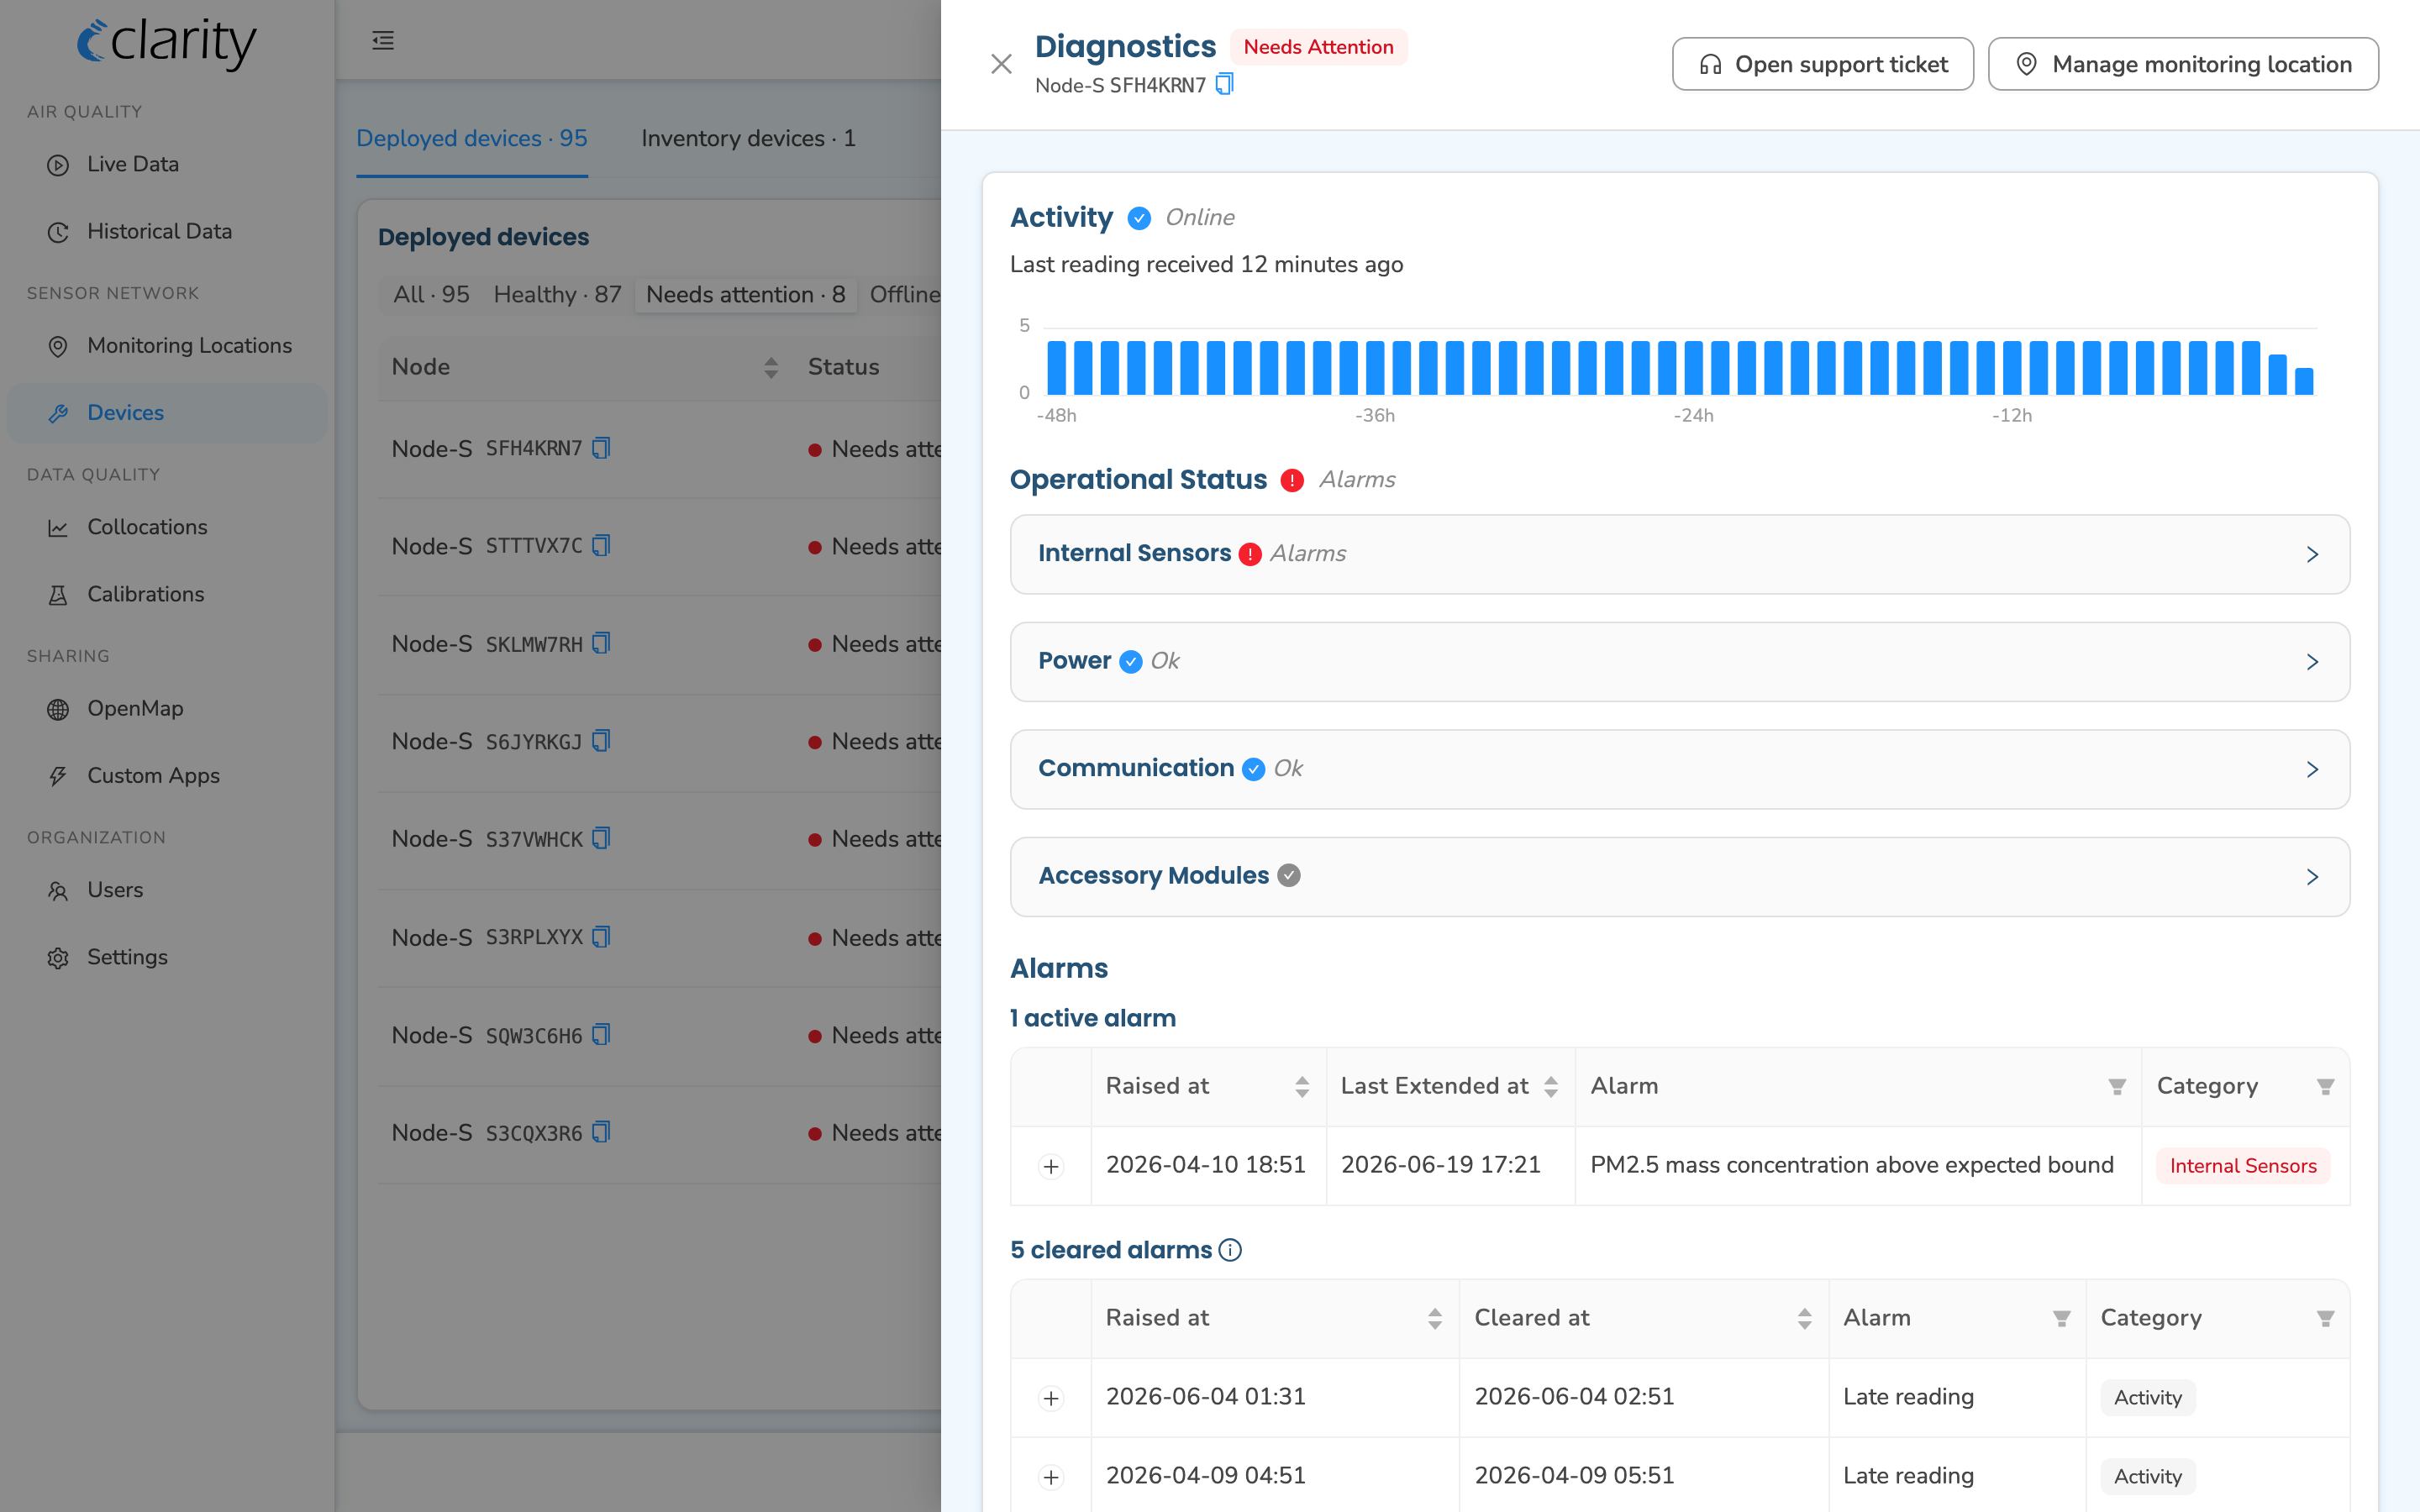
- Diagnostics — opens the per-node Diagnostics drawer (Activity, Operational Status, active alarms).
- Manage monitoring location — jumps to that location's card in Monitoring Locations.
- Open in Live Data — focuses that location on the Live Data map.
- Load historical data — opens the load-historical-data picker for that location.
On a needs-attention or offline row, a one-click wrench shortcut to Diagnostics also appears next to the status dot.
Row actions on an inventory device are the configuration verbs:
- Configure node (nodes) or Pair module (modules) — role-gated.
- Compatible modules (for a node) / Compatible nodes (for a module) — opens a compatibility lookup.
Where the lifecycle actions live
Lifecycle actions live on the surfaces where they make the most sense:
- Configure a node → the Configure node wizard (top-right button, or the inventory row's "Configure node").
- Pair / unpair a module → the Pair module wizard (top-right button / inventory row), or the in-place Pair module action on a location card in Monitoring Locations.
- Edit configuration, Replace node, Stop monitoring, Change power, Tune placement → the location's card in Monitoring Locations (see below).
- View compatible modules / nodes → the inventory-row Compatible modules / Compatible nodes action.
Managing a location (Monitoring Locations)
Where: Sensor network → Monitoring Locations
Monitoring Locations is the roster of your deployed monitoring sites (also referred to as "Datasources" in the API). It defaults to a table view, with a map view one click away. Filter by Running vs Stopped, and refine running locations by Healthy / Needs attention / Offline / Expiring soon / Managed elsewhere.
Selecting a location opens its card in the left panel — the home for most per-location lifecycle work:
- Identity header with an Edit action (name, group, tags).
- A Devices block with Replace node, Pair modules, and Change power actions, plus an Attach node from inventory action for stopped locations.
- Diagnostics button (opens the same drawer as the Devices page).
- Alarm rules that apply to this location, with create/edit entry points.
- OpenMap sharing — a Public/Private toggle to show this location publicly.
- Data access — subscription expiry and sharing details, plus deployment history.
- Deployment — site context (indoor/outdoor, height, road distance, deployment photo, mini-map), with a Tune placement action.
- Download data and Stop monitoring location at the bottom.
To add a location, use + Add. Admins, org admins, and technicians get a choice between deploying a Clarity node, subscribing to a reference monitor, or pairing a module; other members go straight to the inventory picker.
Historical data download (Downloads)
Where: top-bar download tray → Downloads (route /downloads)
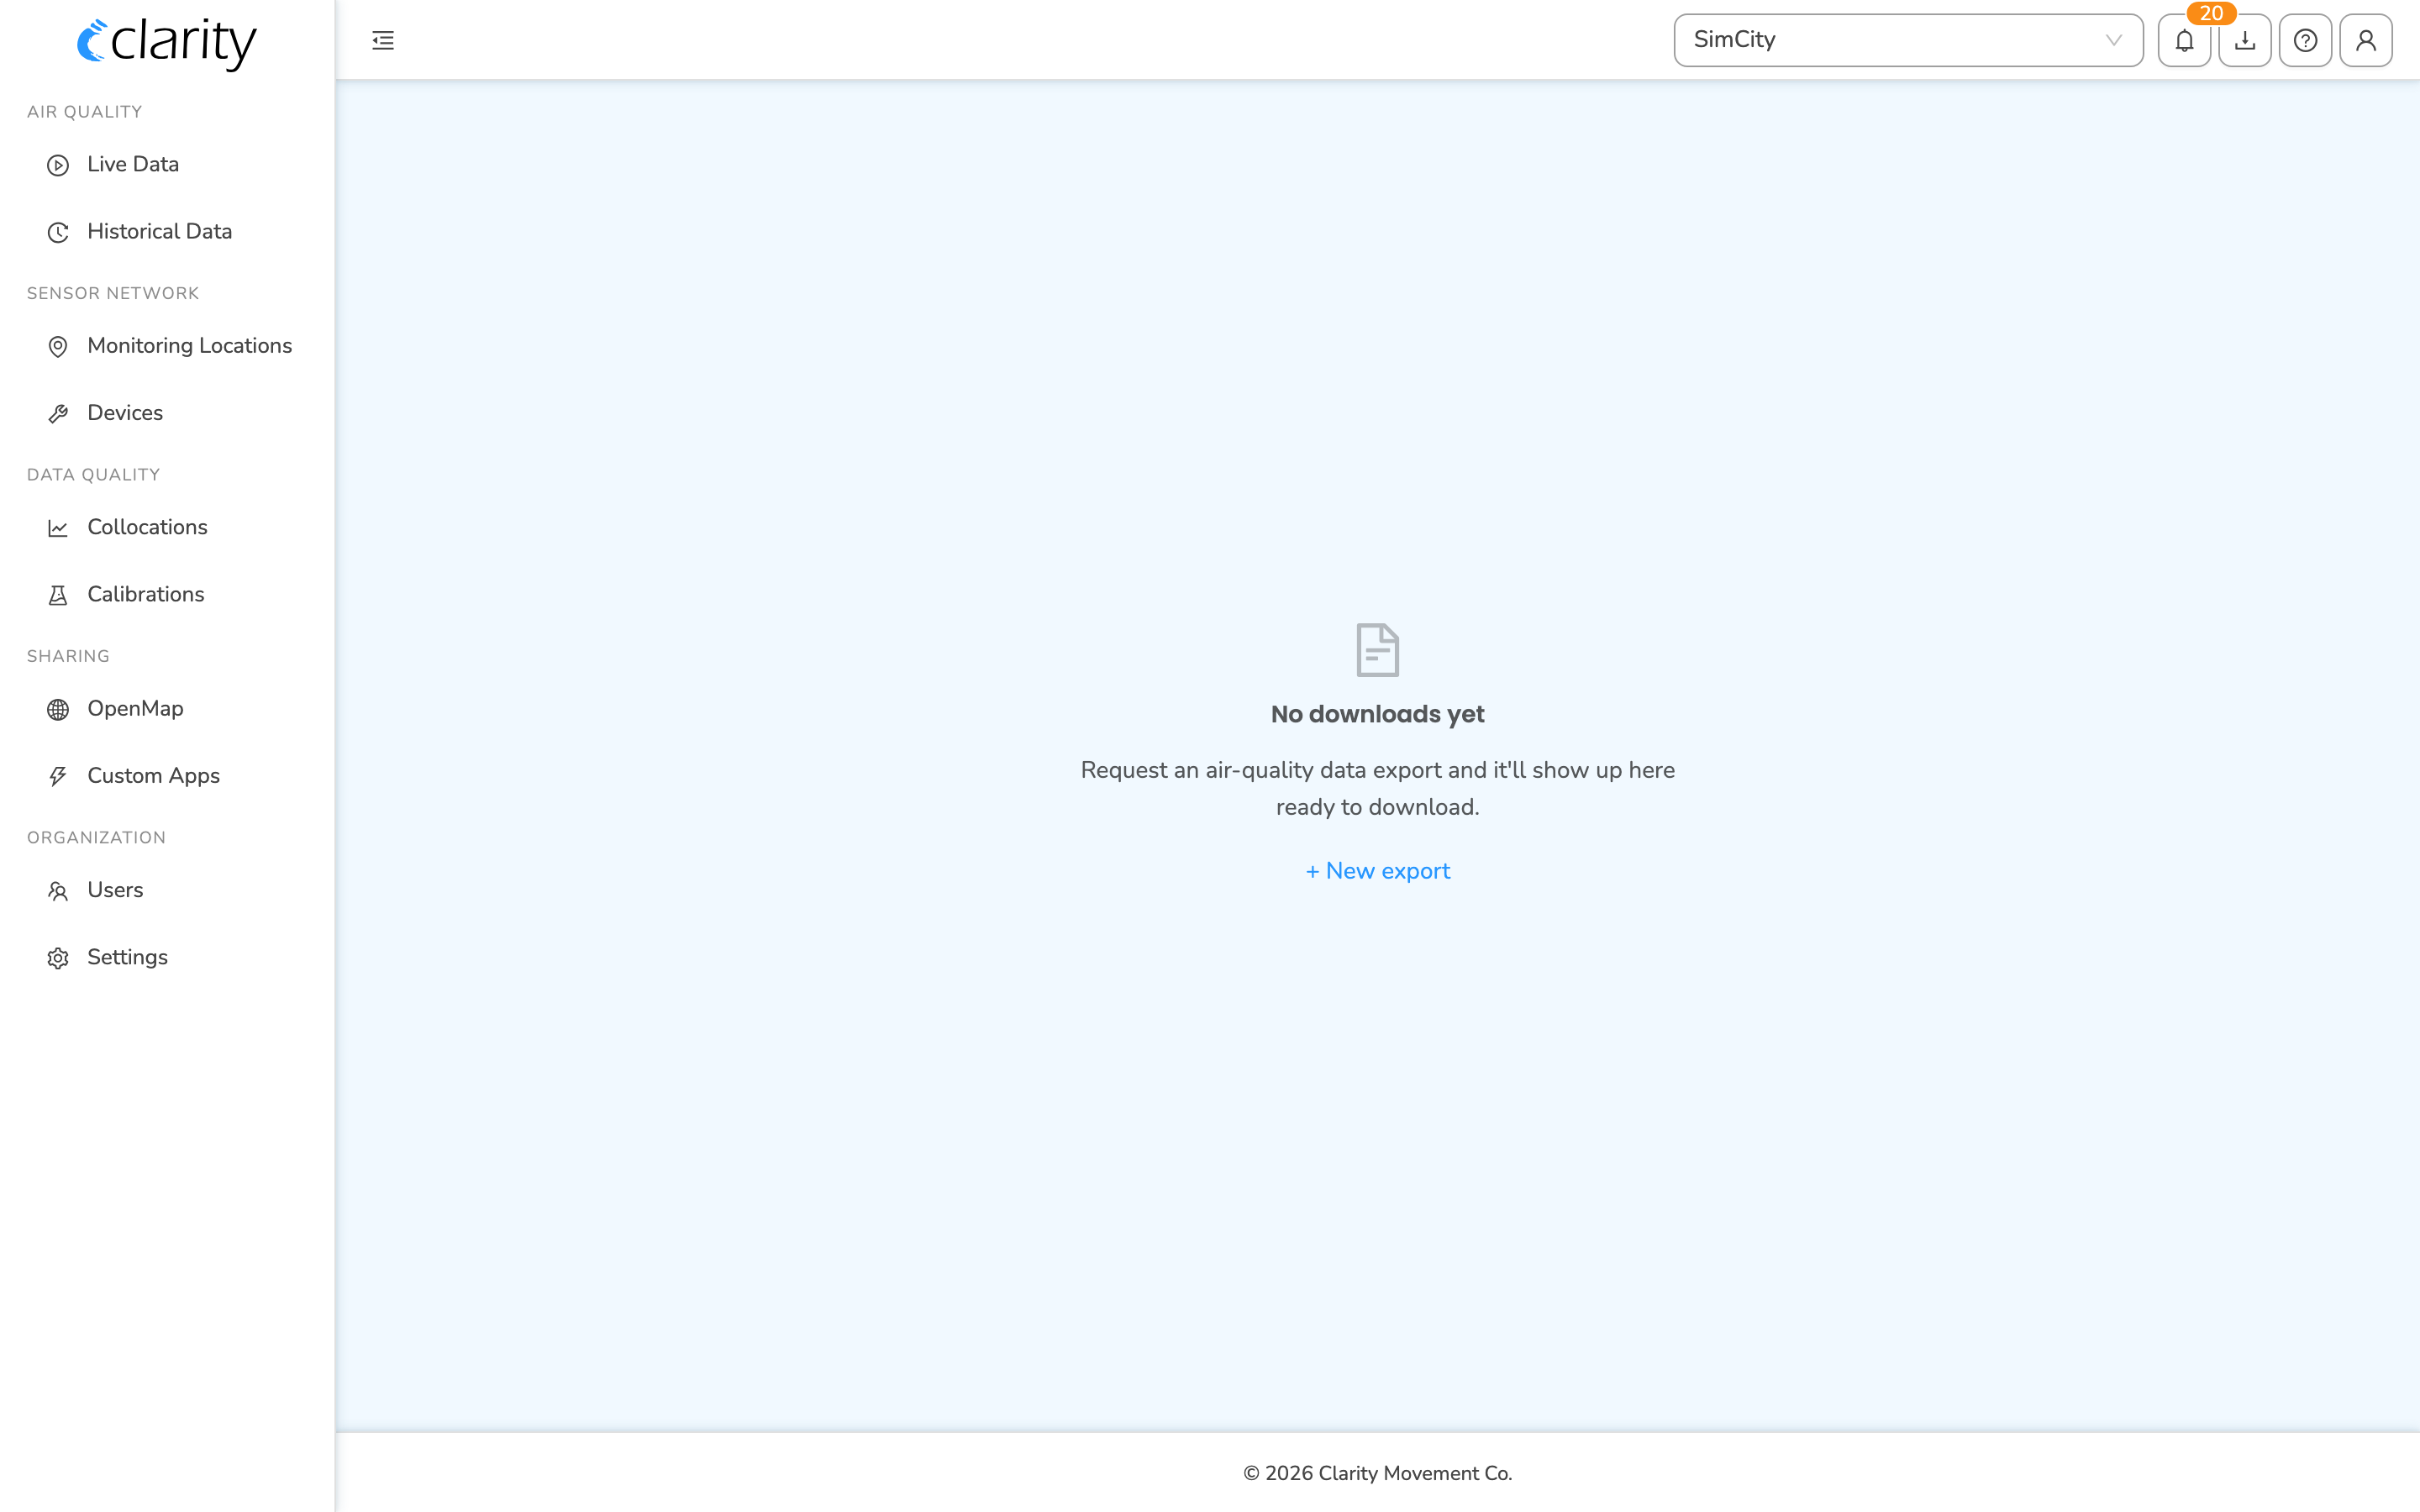
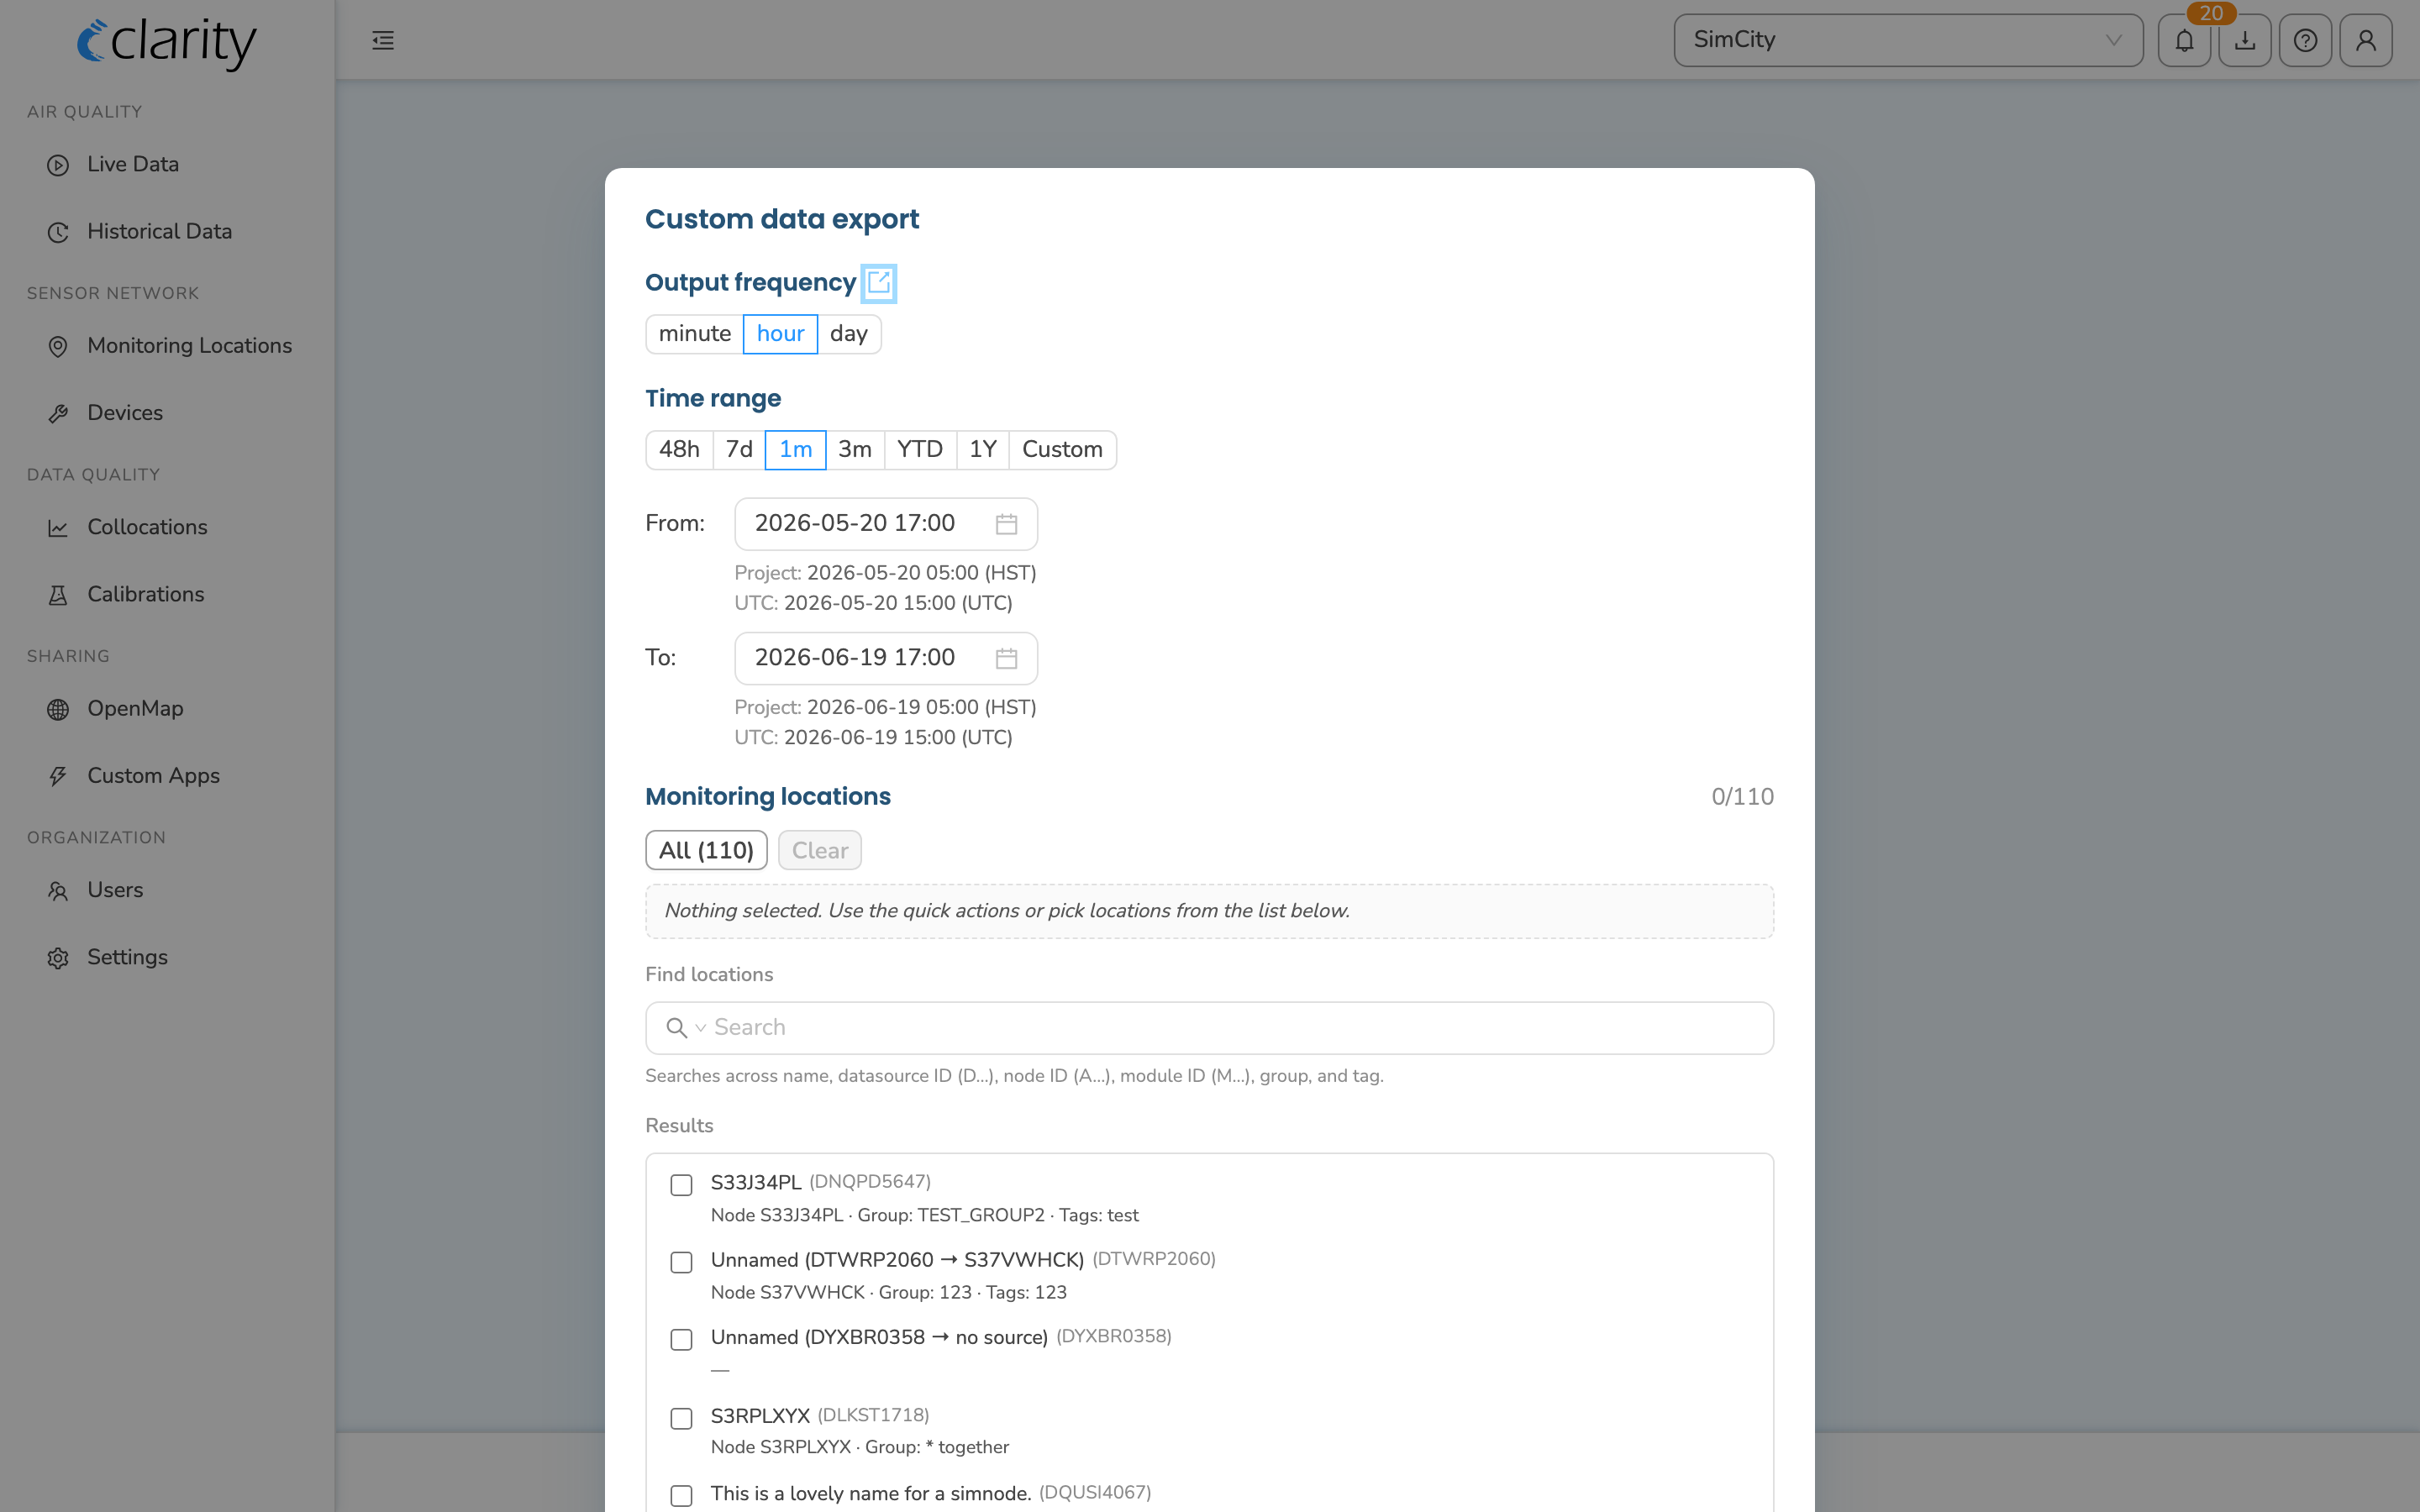
Downloads is your queue of ad-hoc data exports. Request an export and it processes in the background, then appears in the list ready to download as CSV or Parquet for detailed reporting. Each row shows when it was requested, who requested it, what was exported, a summary, and a status (Processing / Ready / Expired / Failed) with a retention date. Click a row to expand its detail and per-row actions (download, request again, delete).
To create a new export, use + New export, which offers:
- By Datasource (by monitoring location), or
- By Node.
You can also start an export scoped to a single location from that location's Download data button in Monitoring Locations.
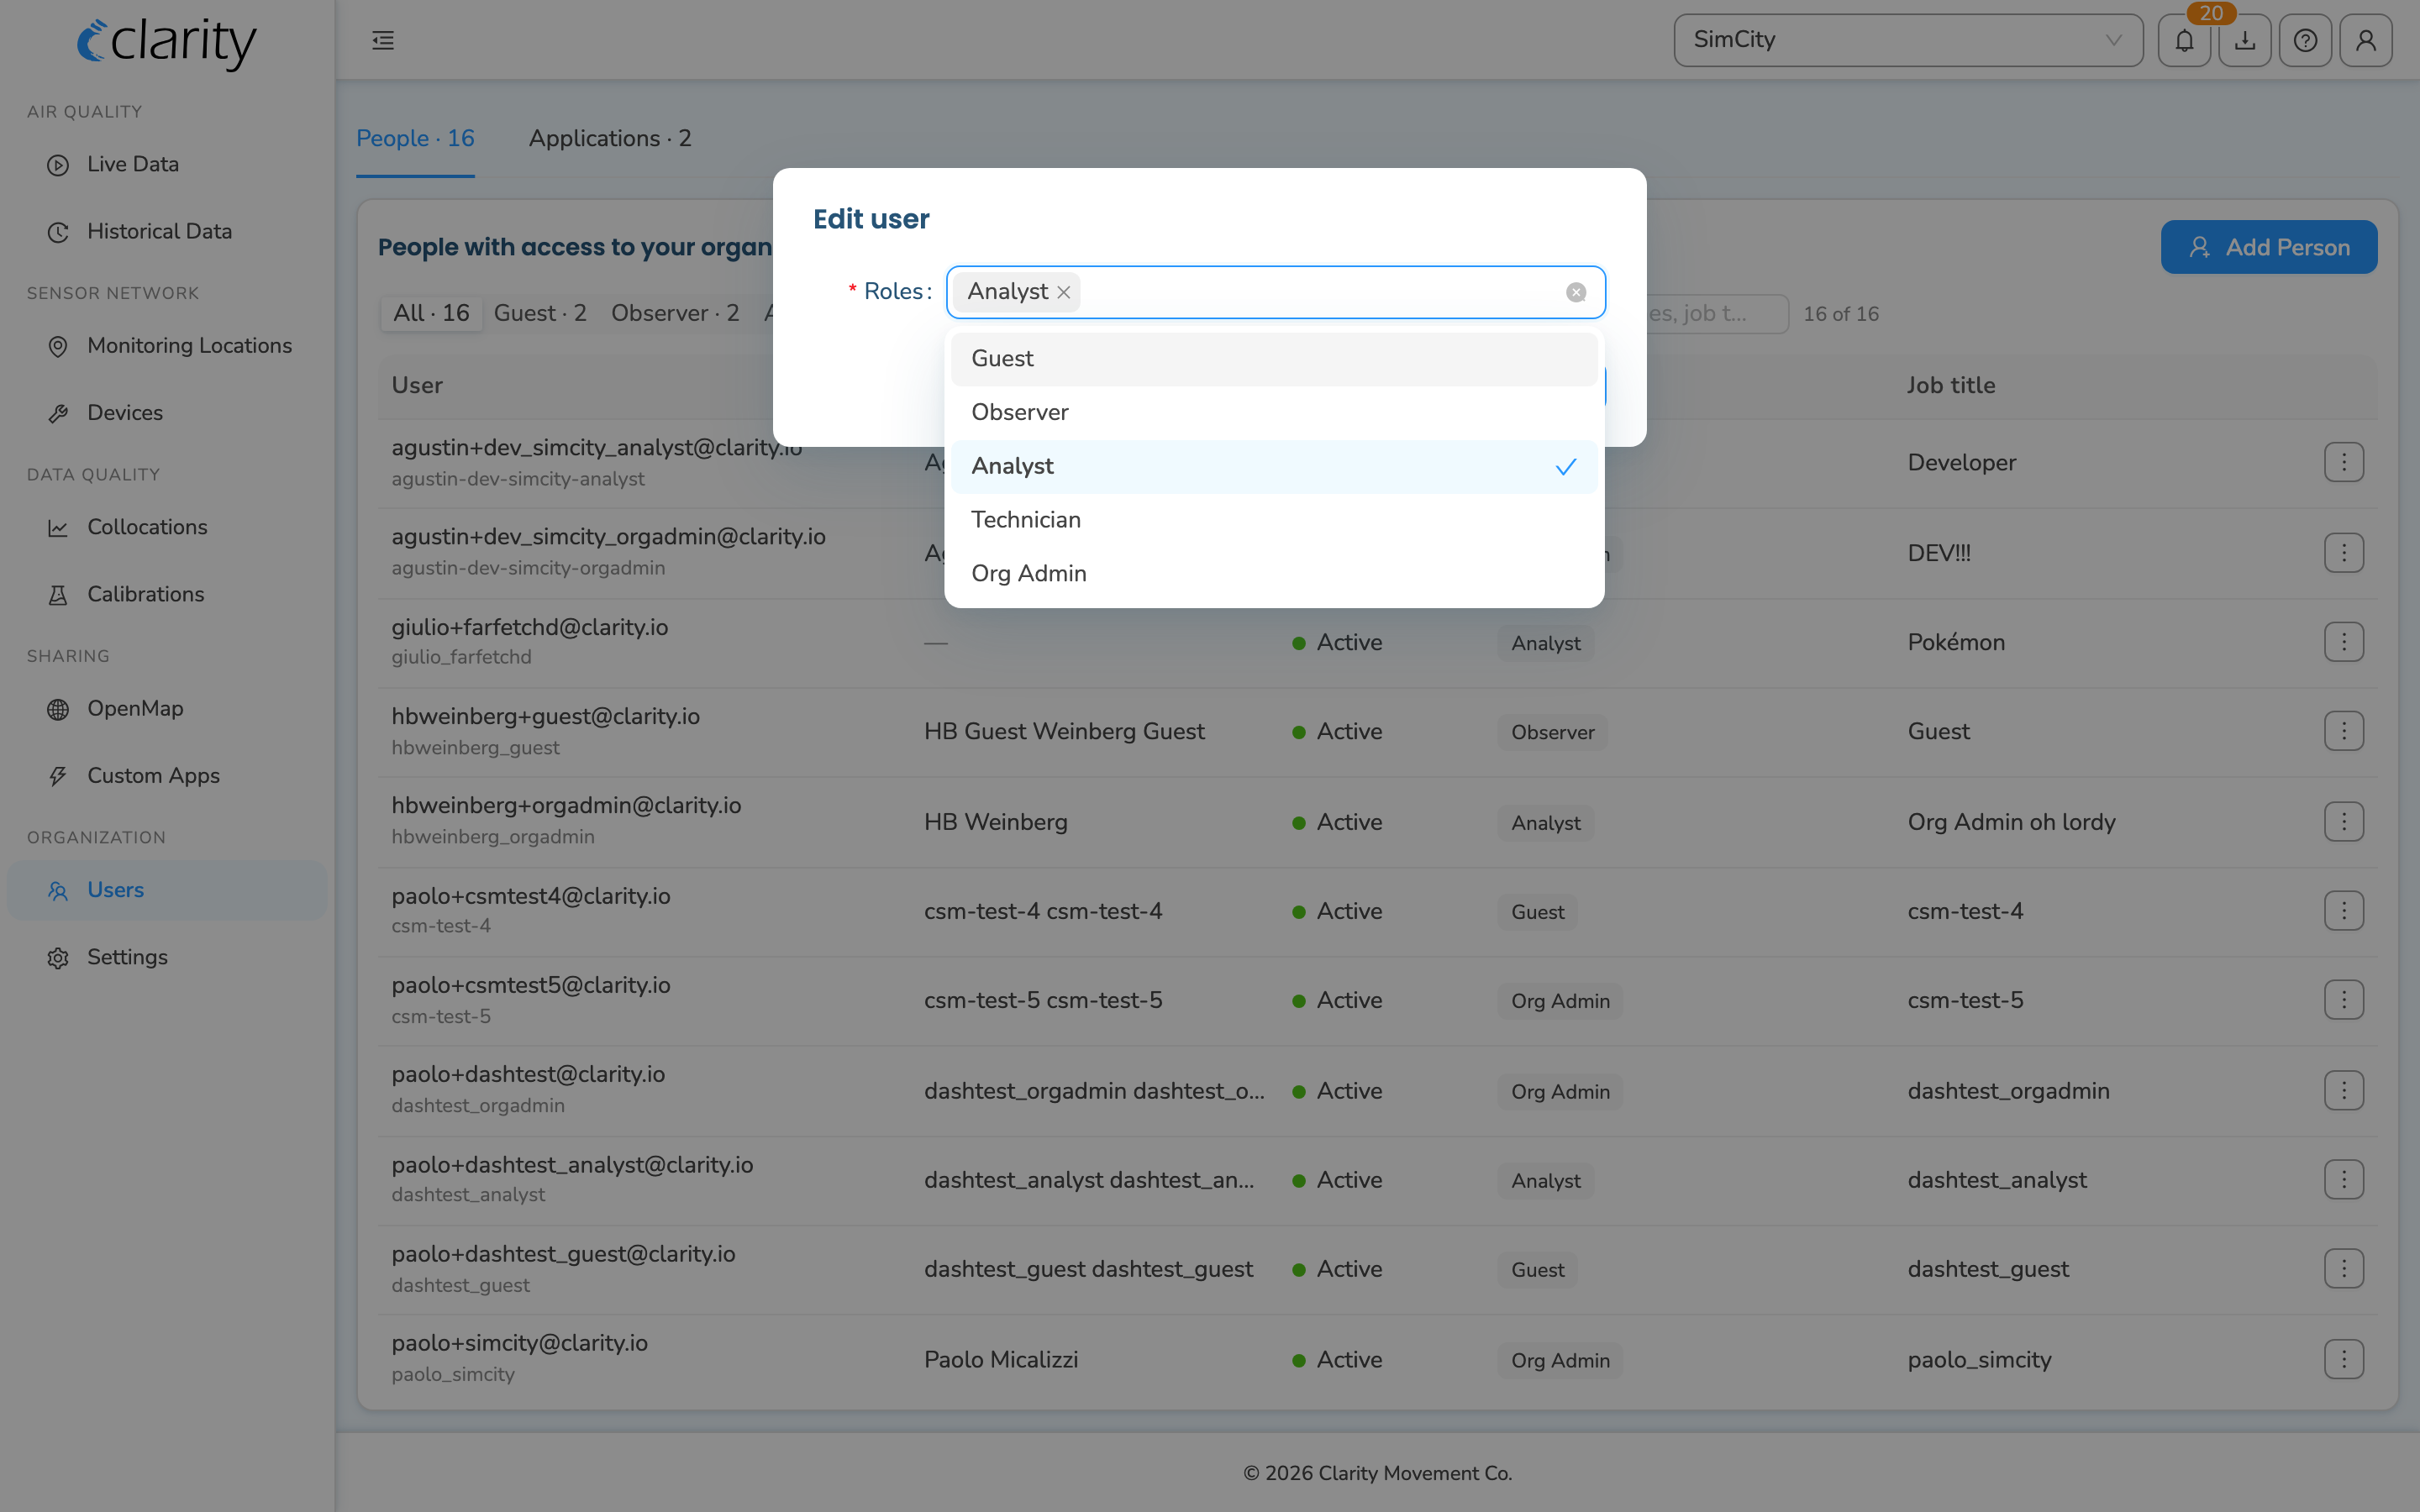
Collaboration and data-sharing control (Users)
Where: Organization → Users
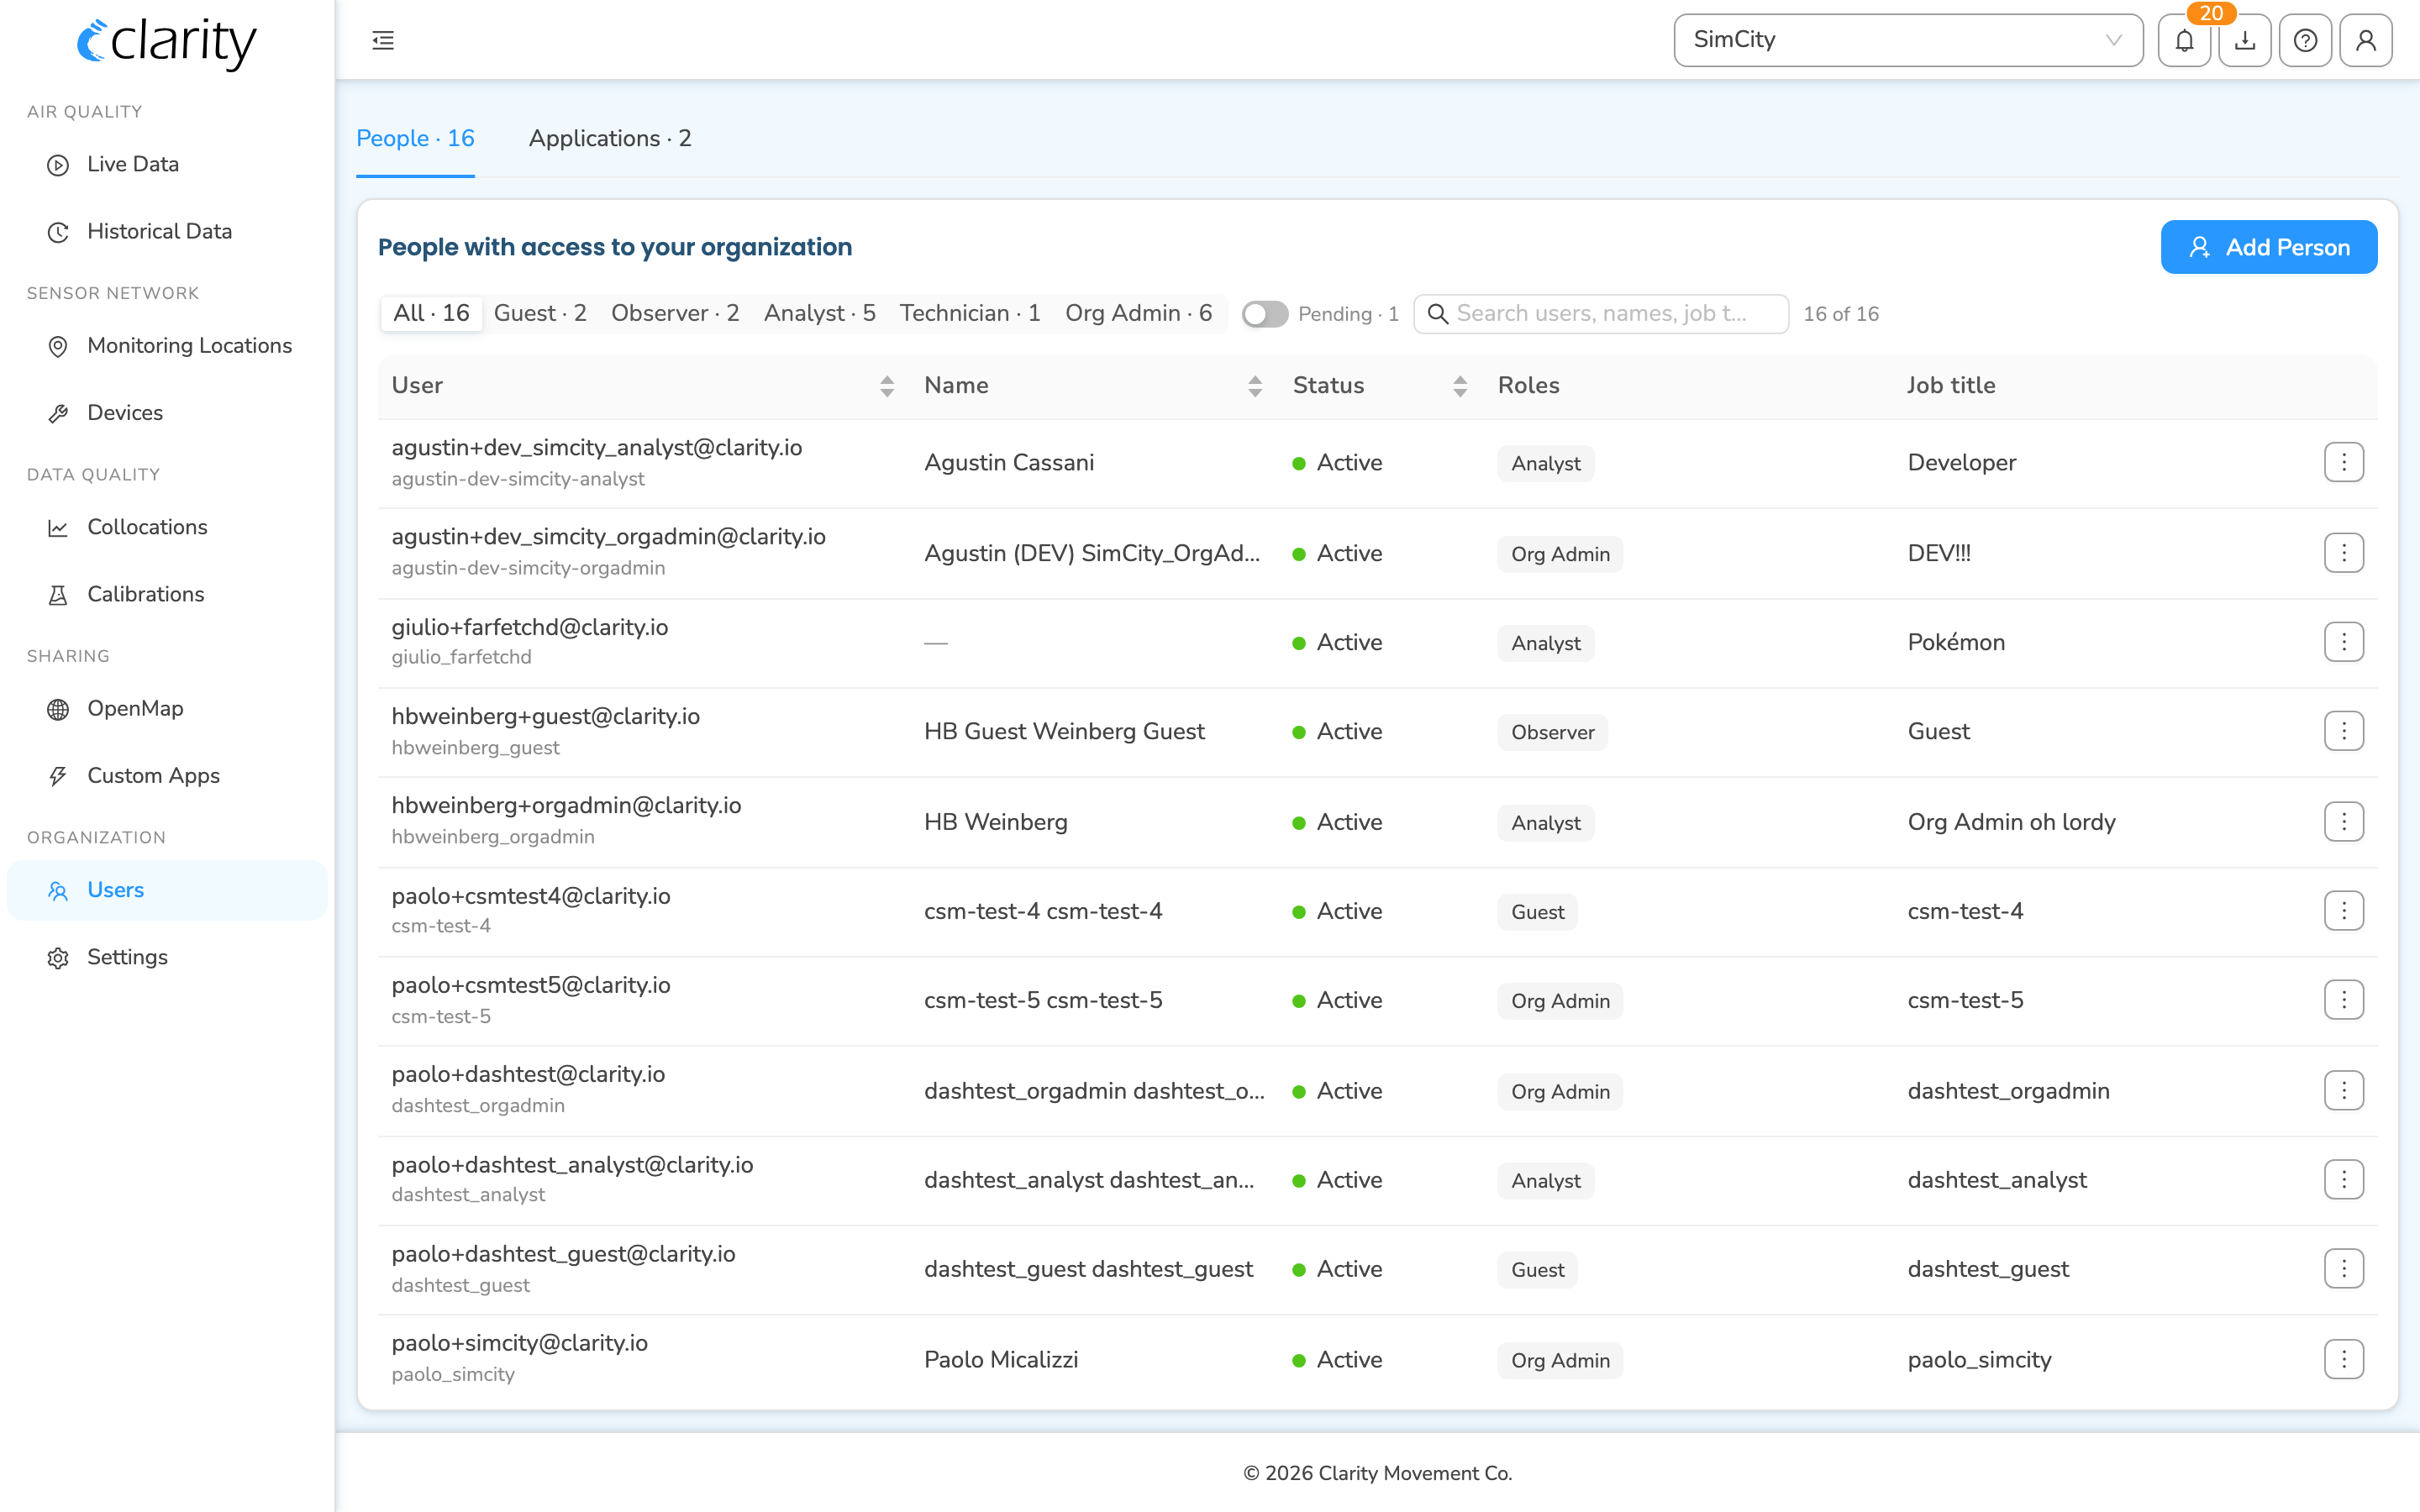
The Users page folds People and Applications into one tabbed surface.
- People lists members and pending invitations. Add teammates with Add Person, and use a row's actions to edit roles or remove a person. Guests are managed in an in-place modal on this page.
- Applications lists API applications connected to your org.
Roles available when editing a user: Guest, Observer, Analyst, Technician, and Org Admin. Guests get limited, read-only access; assign higher roles for analysis and device management.
Data quality (Collocations & Calibrations)
Where: Data quality → Collocations / Calibrations
Collocations surfaces Clarity-node ↔ reference-site pairs — any Clarity node within 200 m of a reference site shows up here automatically. Select a pair to inspect paired measurements with histogram, time-series, correlation scatter, and deviation views over a chosen window (7d / 30d / 90d / Custom), with a Show Raw / Data Cleanup toggle.
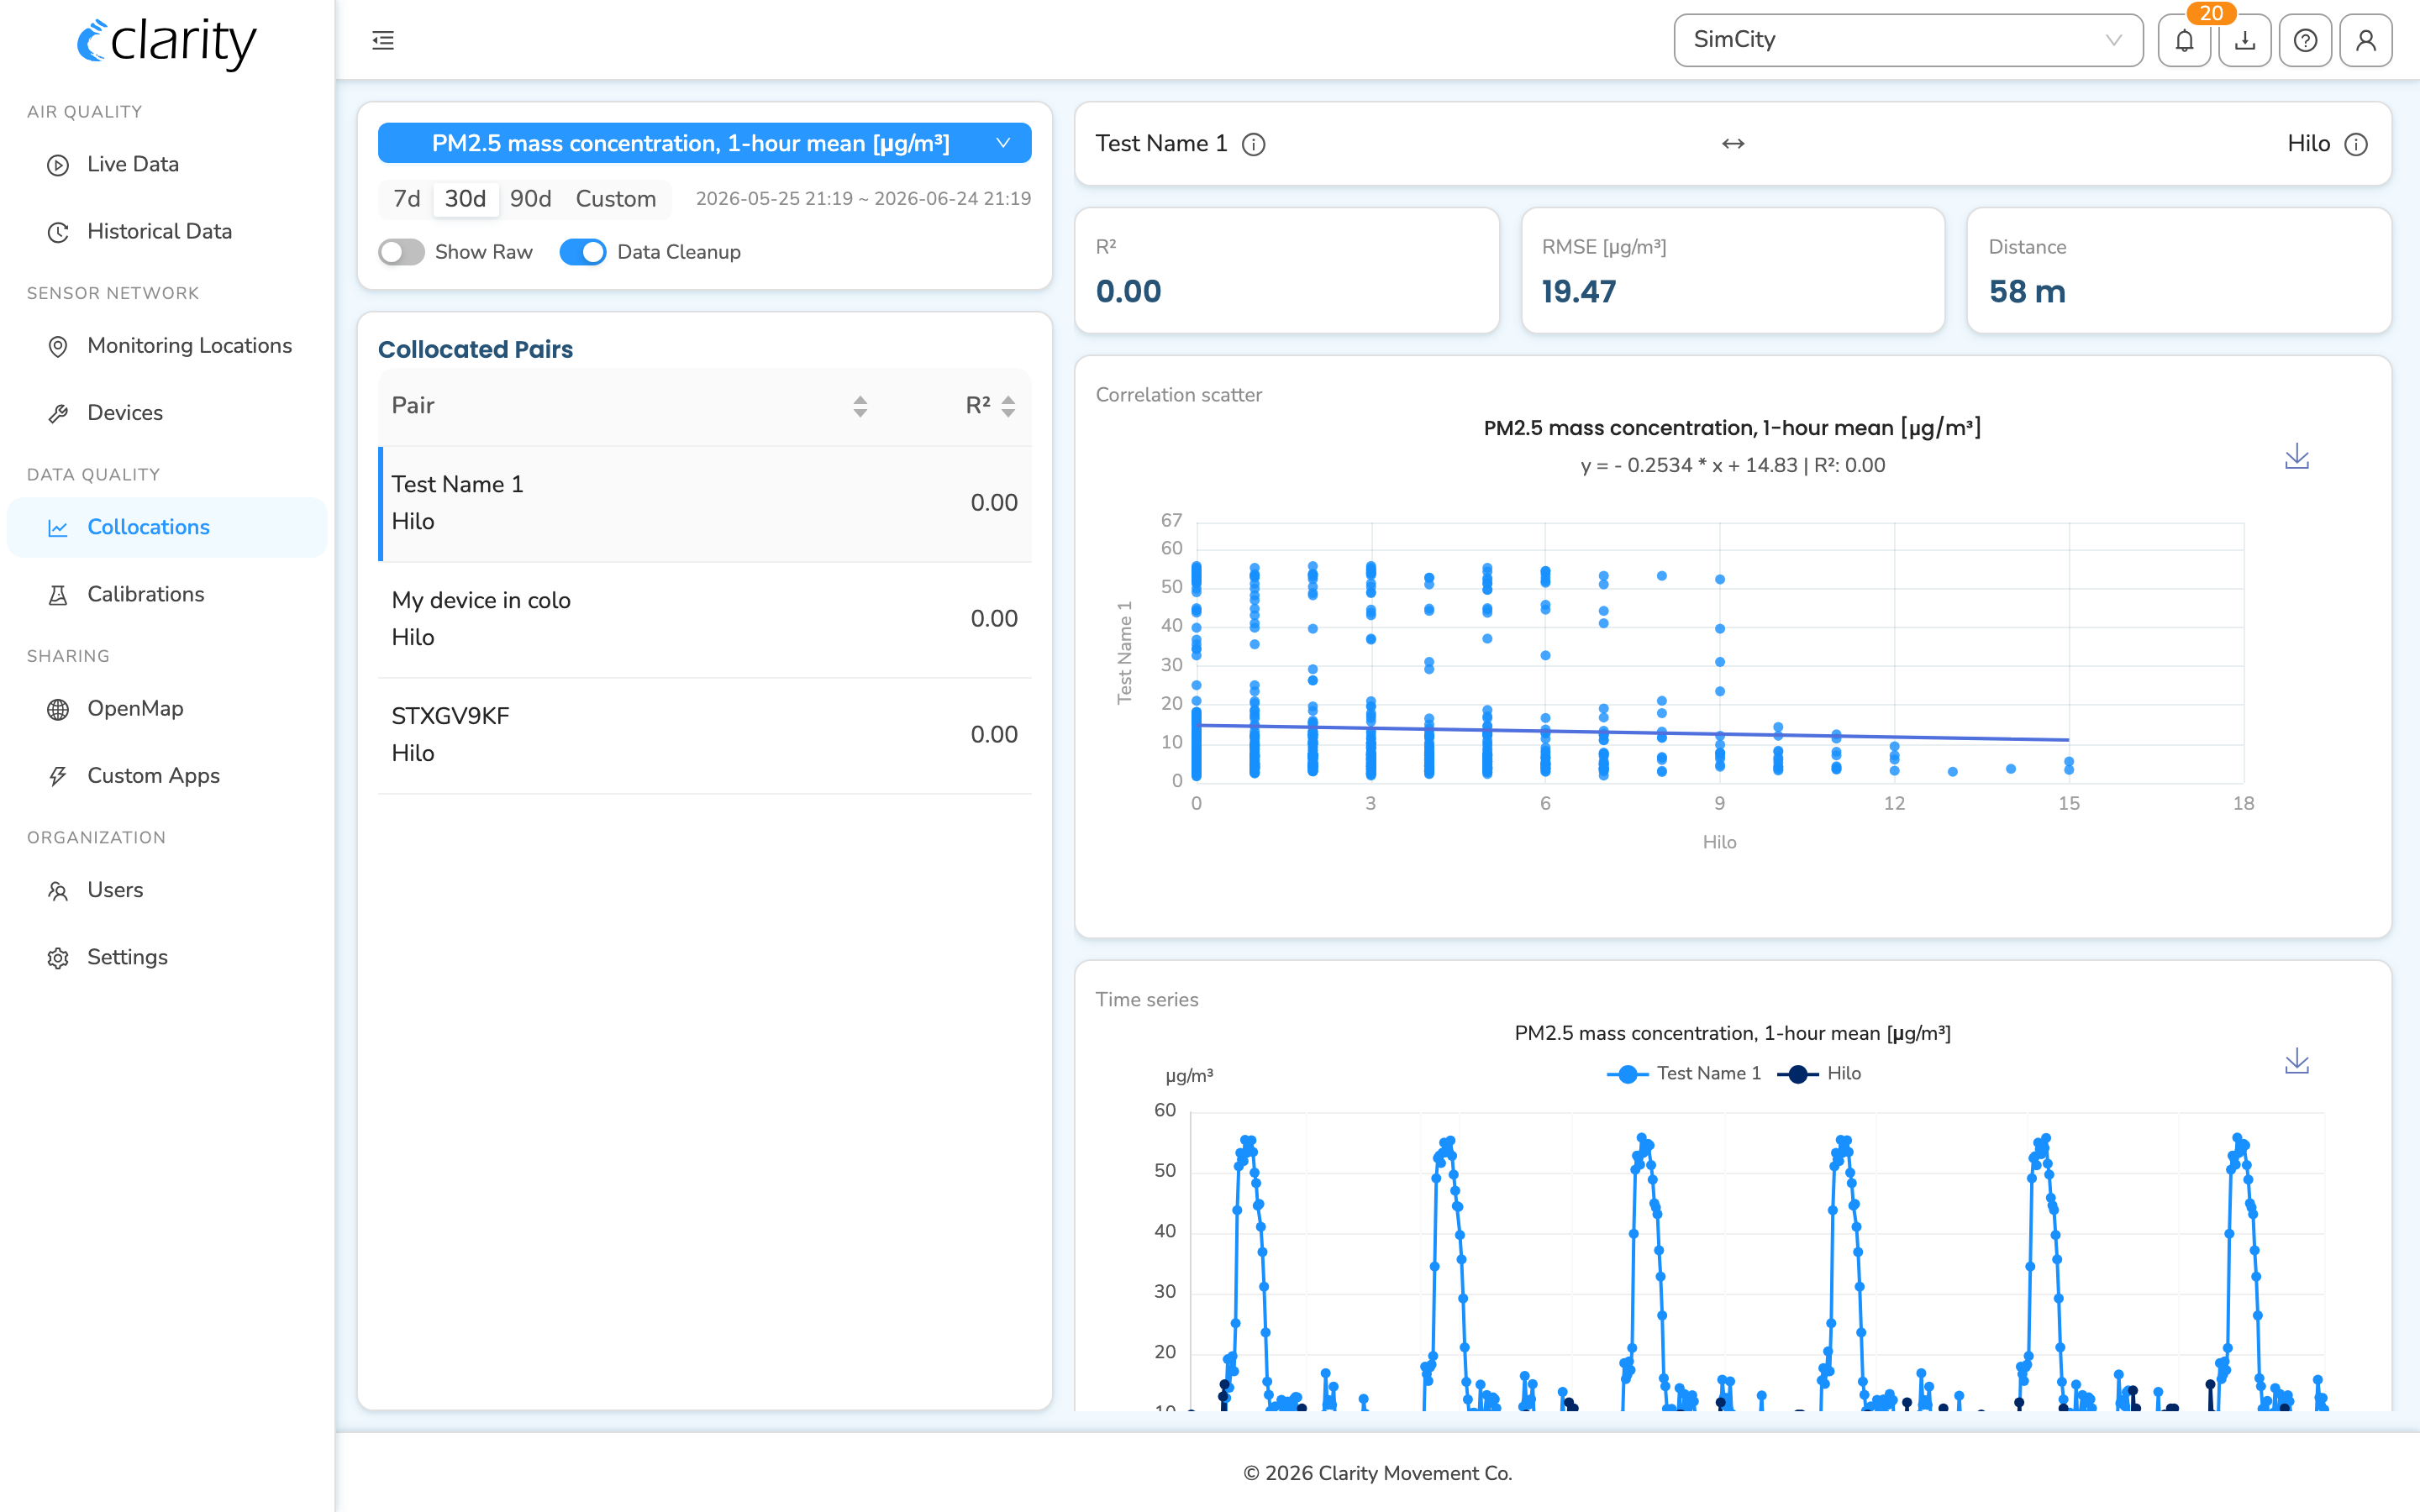
When an org has no qualifying pairs, the page explains: "A collocation is a Clarity node within 200 m of a reference site. Once you have both nearby, the pair will show up here automatically."
Calibrations is its own top-level page for cloud calibration.
OpenMap
Clarity OpenMap is a public air quality data-sharing platform for community access to real-time PM2.5 and AQI information. You can choose to share a location's data on OpenMap with a simple toggle on the location's card in Monitoring Locations (under OpenMap sharing). OpenMap empowers communities with accurate air quality insights, letting residents monitor current conditions and track long-term trends — supporting local advocacy for cleaner air.
Key features:
- Real-time air quality data — hourly NowCast AQIs for up-to-date conditions.
- Historical trends — day, week, month, and year views reveal patterns over time.
- Accessibility — simplified visuals make it easy to explore and compare locations.
- Transparency — information on calculation methods and data sources builds trust.
OpenMap can be embedded directly into your organization's website via iFrame, making it easy to share insights with a broader audience.
API
The Clarity API is a REST API that lets you access data from your Clarity air monitoring network. It offers endpoints returning resources in JSON and tabular formats, designed to be easy to integrate. Use it to retrieve recent and historical air quality measurements and network-management data, and to continuously integrate your Clarity data with existing systems, data-analysis notebooks, GIS applications, environmental models, or third-party dashboards. API applications connected to your org are listed under Users → Applications.
What's next
- Get an overview of your network on Live Data.
- Manage your nodes on Dashboard.
- Learn how to access your measurement data.
- Understand user roles and permissions.
Was this article helpful?
Yes, thanks! / Not really
Still need a hand? Email us at support@clarity.io or create a support ticket, and our team will get back to you.