Check a device's calibration
How to find which calibration is applied to nodes and modules across your network
What is calibration?
Calibration is crucial for obtaining accurate measurements of air pollutant concentrations. It ensures that the data collected by your air quality sensors is reliable and supports informed decision-making. Calibration helps minimize measurement errors and keeps sensor readings aligned with reference instruments. All Clarity Nodes and some Modules use a cloud calibration.
The Calibrations page shows the cloud-calibration configuration of every device your organization manages, plus the full calibration history for any individual device.
How do I open the Calibrations page?
After logging into Clarity Dashboard, open the left sidebar and look under the Data quality group. Click Calibrations (it sits next to Collocations), at /calibrations.

Choosing a device family
The page opens on the Node-S tab. Three tabs across the top split your devices by product family, and each tab shows how many devices of that family the org manages:
- Node-S · n — your Clarity Nodes
- Multi-Gas · n — Multi-Gas modules
- Dust · n — Dust modules
Click a tab to switch the whole page — the summary and the table both refresh for the family you pick. (Switching tabs also clears any search you'd typed.) If a family has no devices, you'll see a short "No … in this org" message instead of a table.
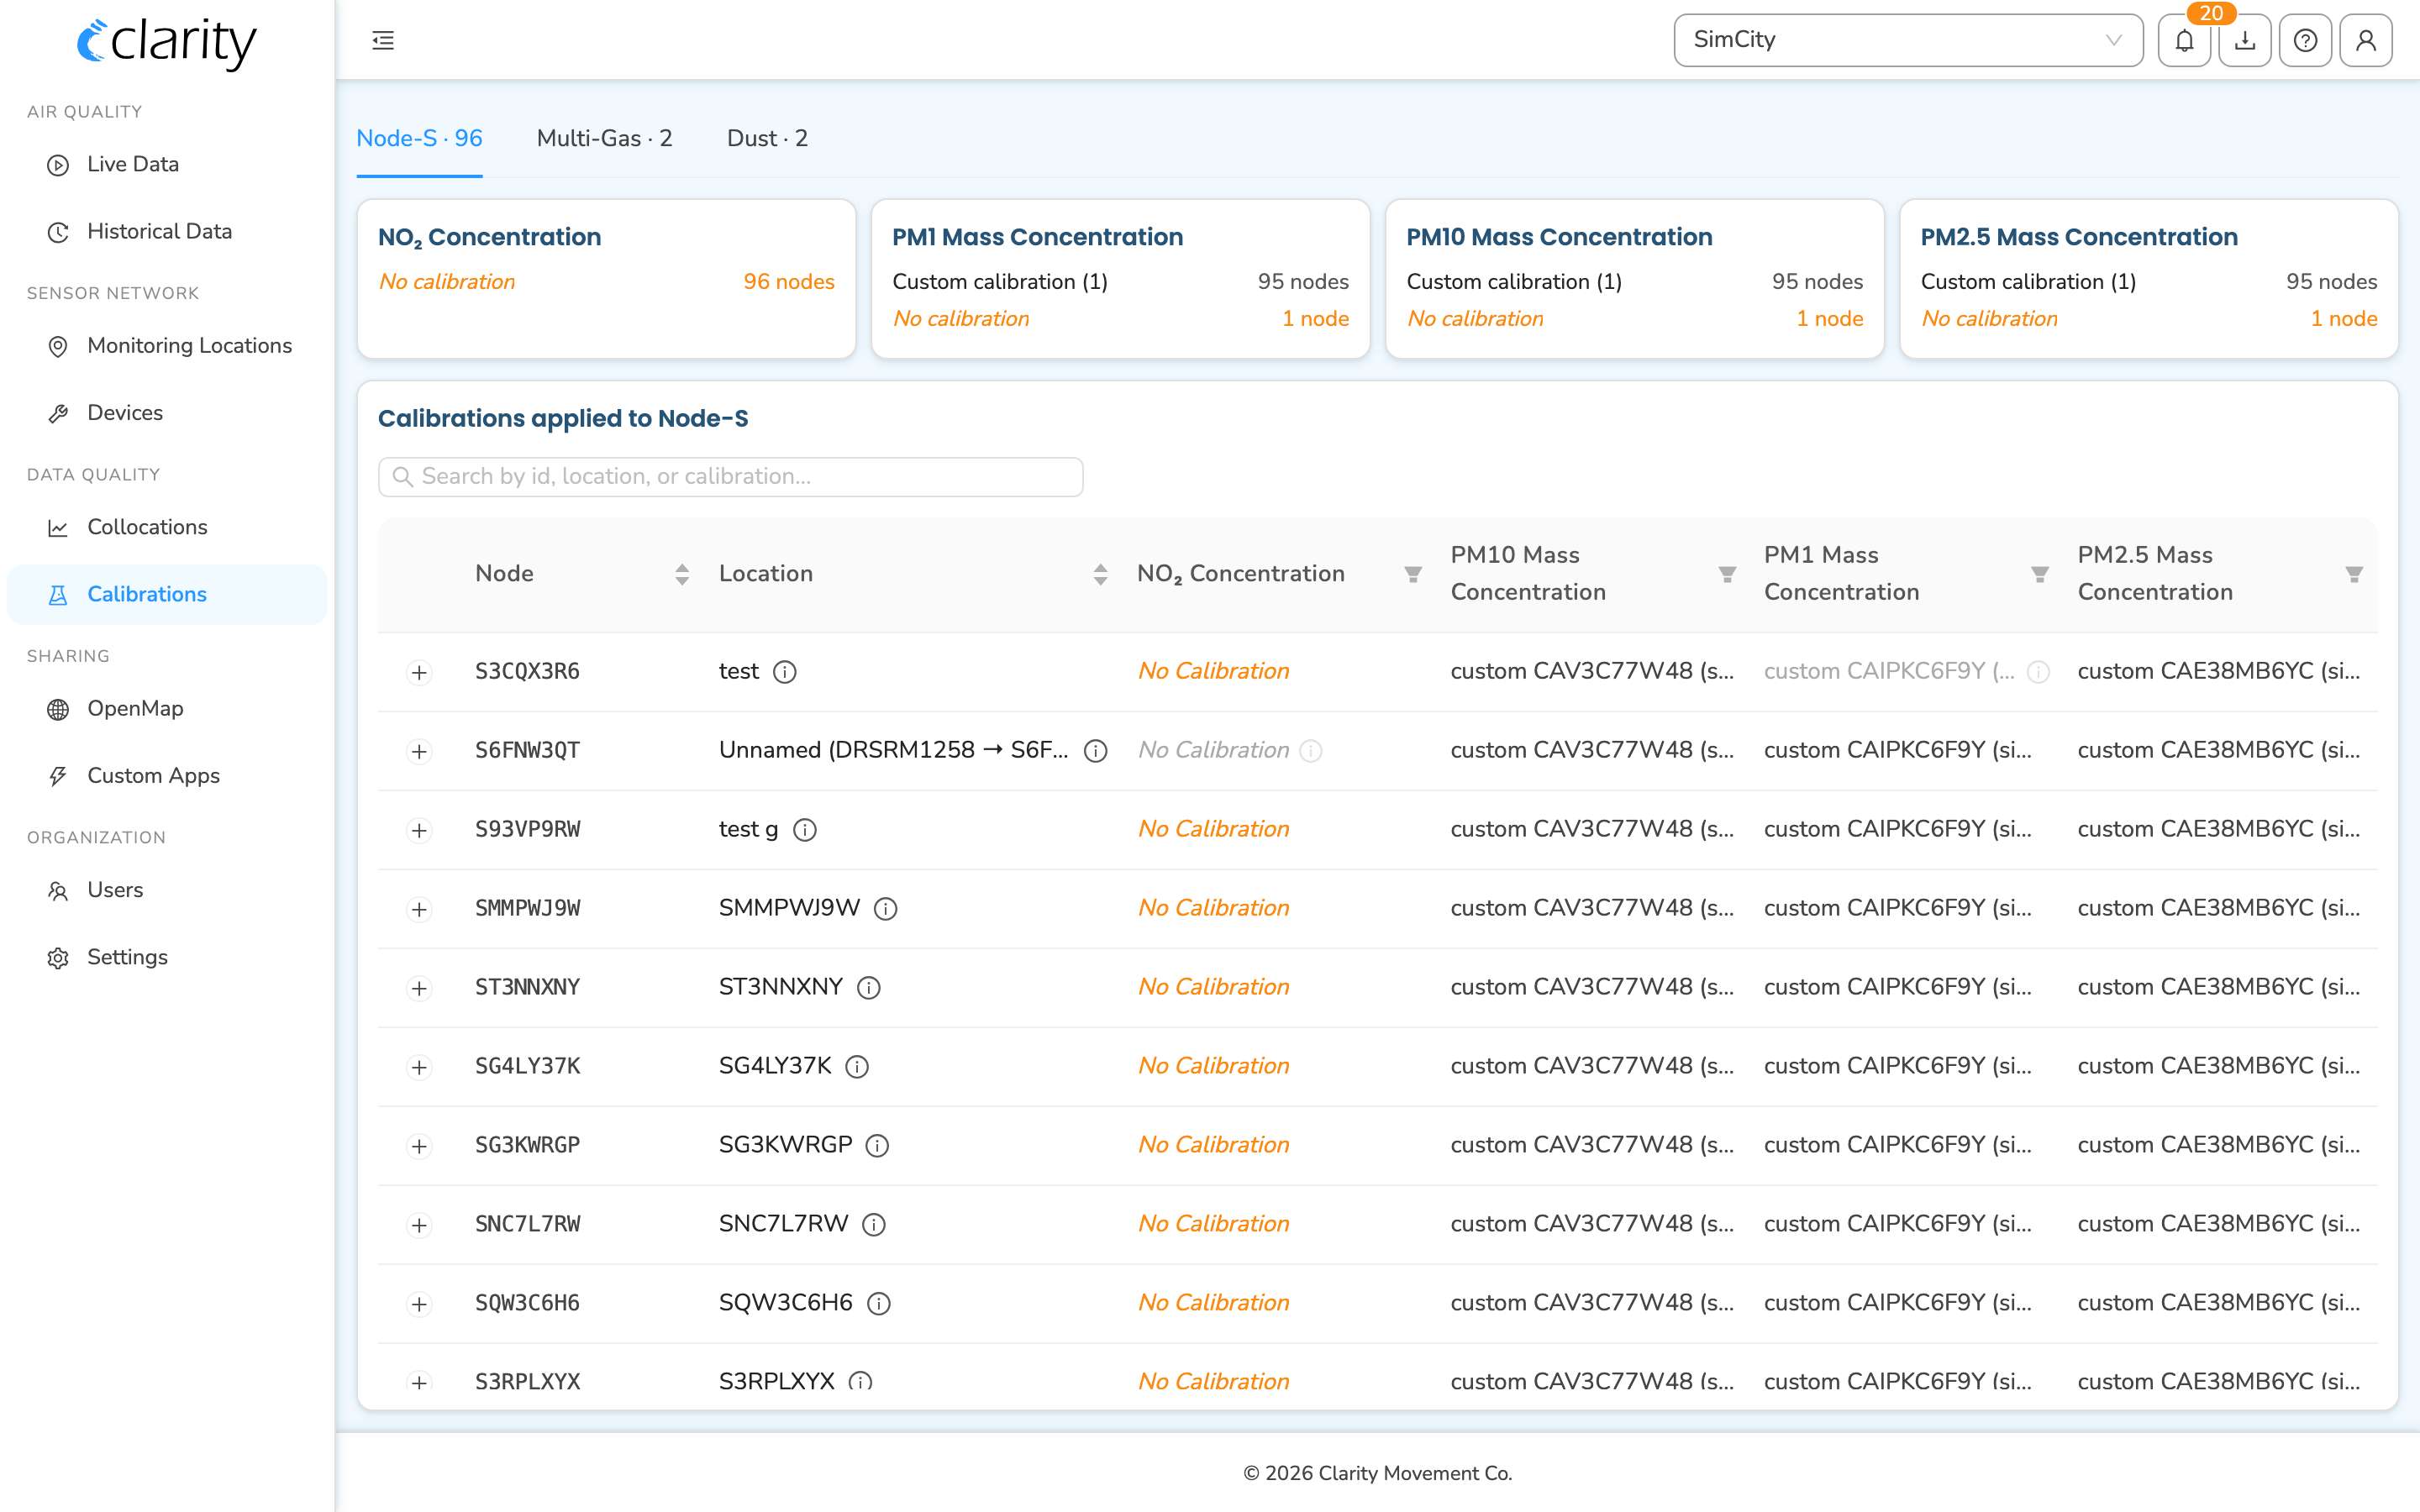
Reading the calibration summary
Just below the tabs is a row of summary tiles — one tile per measured parameter (for example, NO₂ Concentration, PM2.5, etc.). Each tile lists every calibration model in use for that parameter and how many devices in your network have it applied. Devices with no calibration applied are called out (an italic, highlighted "No calibration" row) so gaps are easy to spot. This summary covers all assigned devices in the family — active, not-yet-deployed, and previously deployed.

Finding a specific device
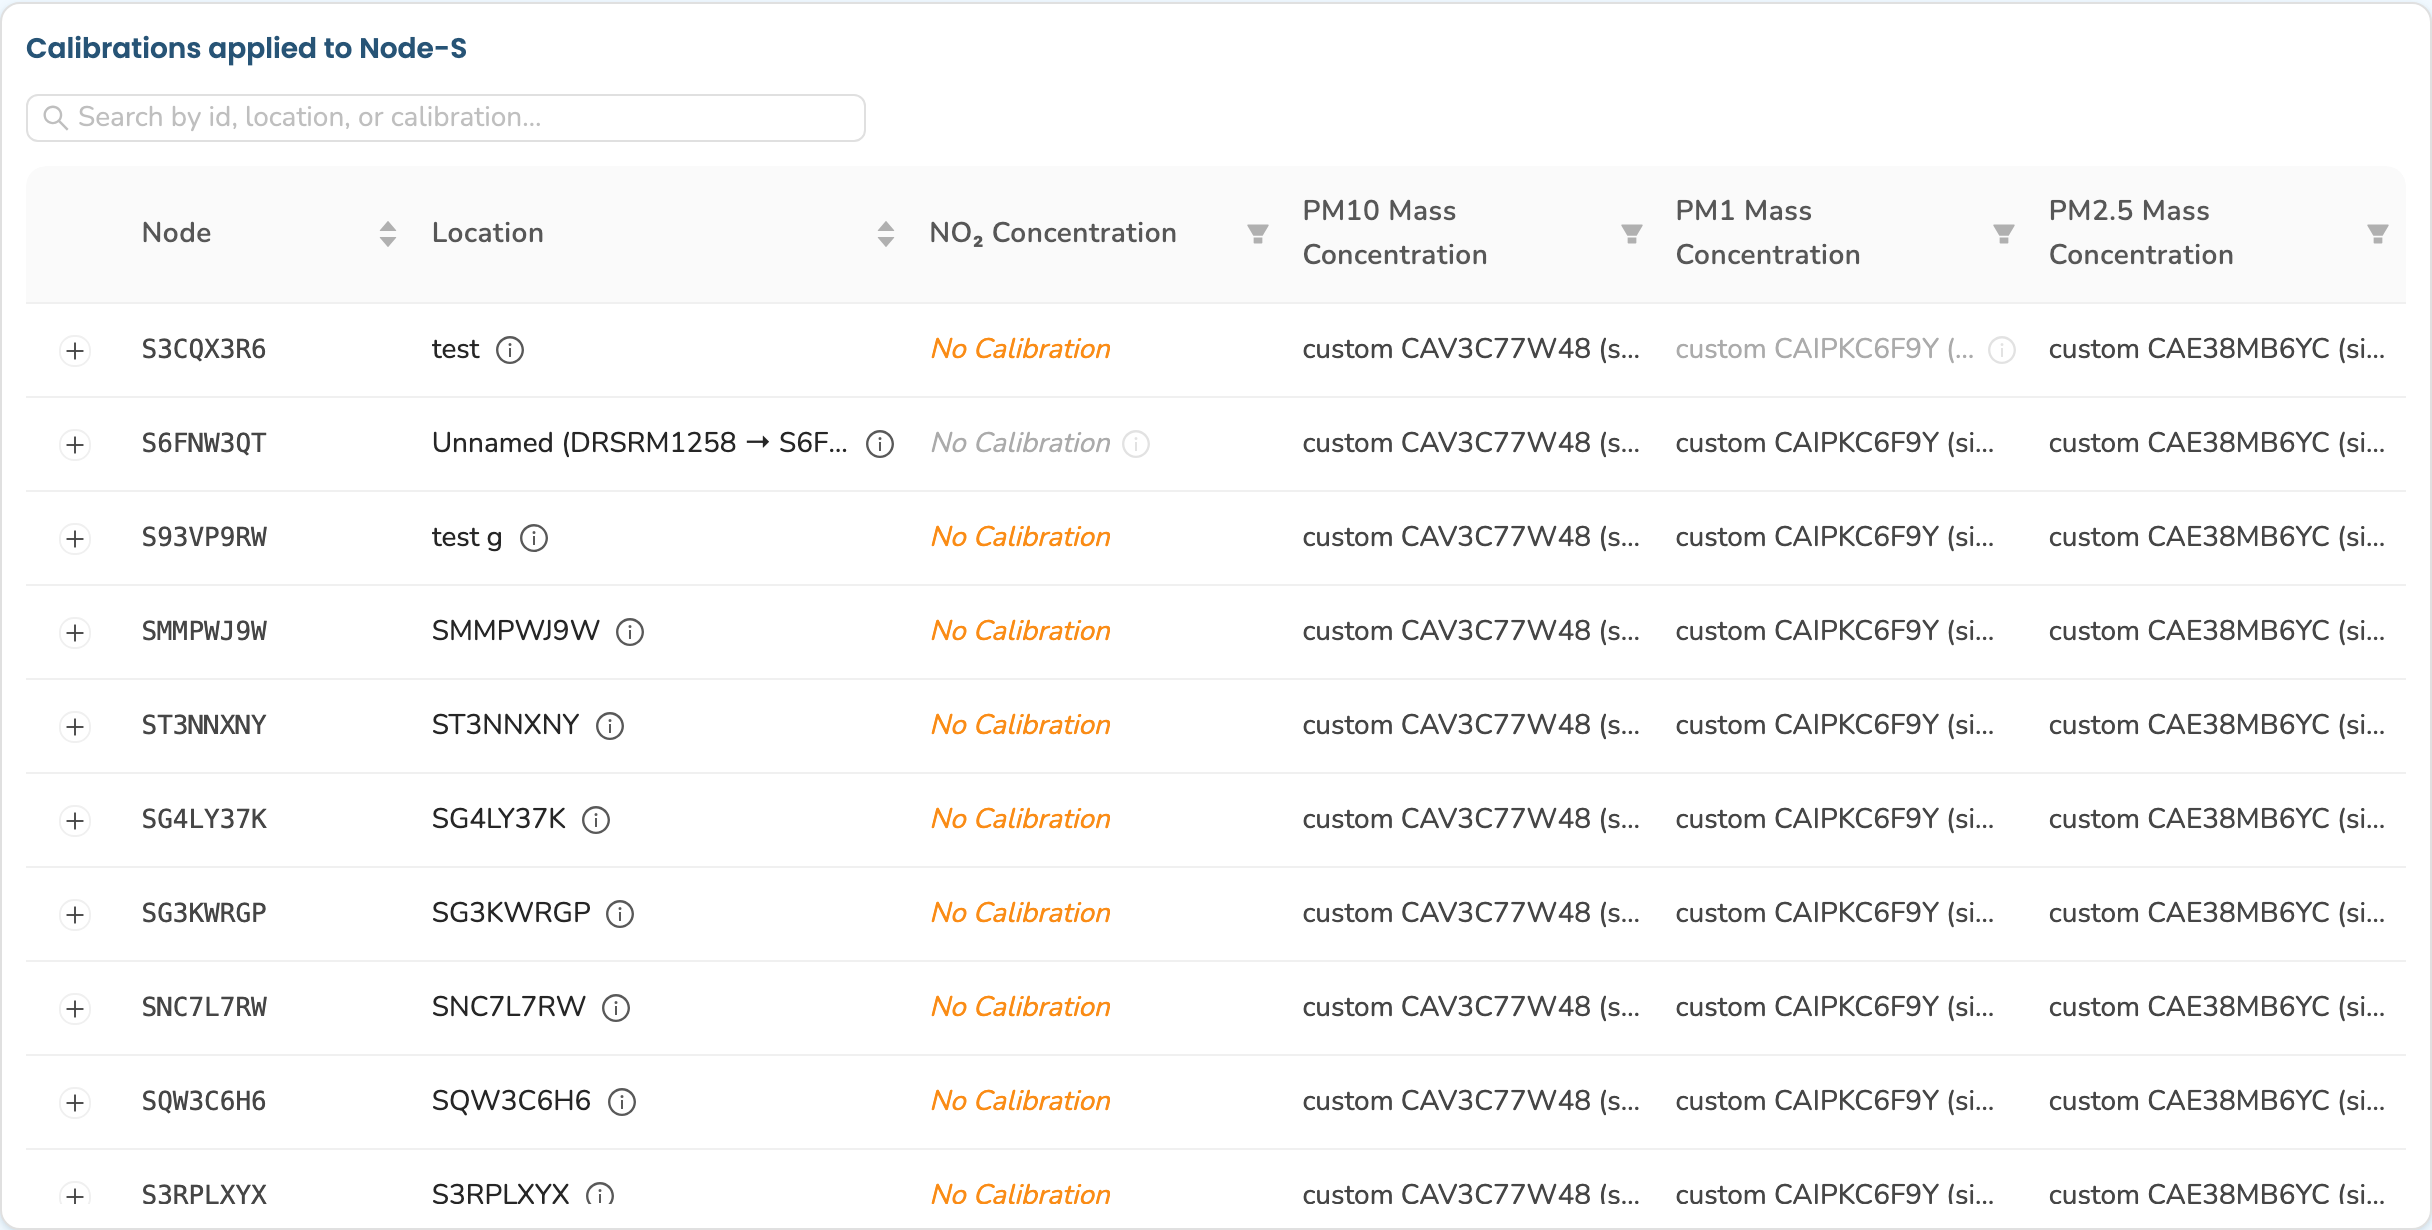
Beneath the summary is the matrix card, headed Calibrations applied to {family} (for example, "Calibrations applied to Node-S"). It's a table with one row per device and one column per measured parameter, so you can scan which calibration each device is running for each parameter at a glance.
- The first column is the Node (or Module) ID.
- The next column is the Location — the monitoring location the device is deployed to. Click the small info (ⓘ) icon next to a location name to pop open its details, including links to view that location elsewhere in the Dashboard. Unpaired modules show "Unpaired".
- The remaining columns show the calibration applied for each parameter. A cell that reads "No Calibration" means none is applied; a greyed-out cell with an info icon means the device isn't currently configured to record that parameter.
To narrow the table, use the Search by id, location, or calibration… box at the top of the card. It matches, case-insensitively, against the device ID, the paired node ID, the location name, and any calibration label in the row. You can also use the per-column filters (the filter icon in a parameter column header) to show only devices running a particular calibration for that parameter.
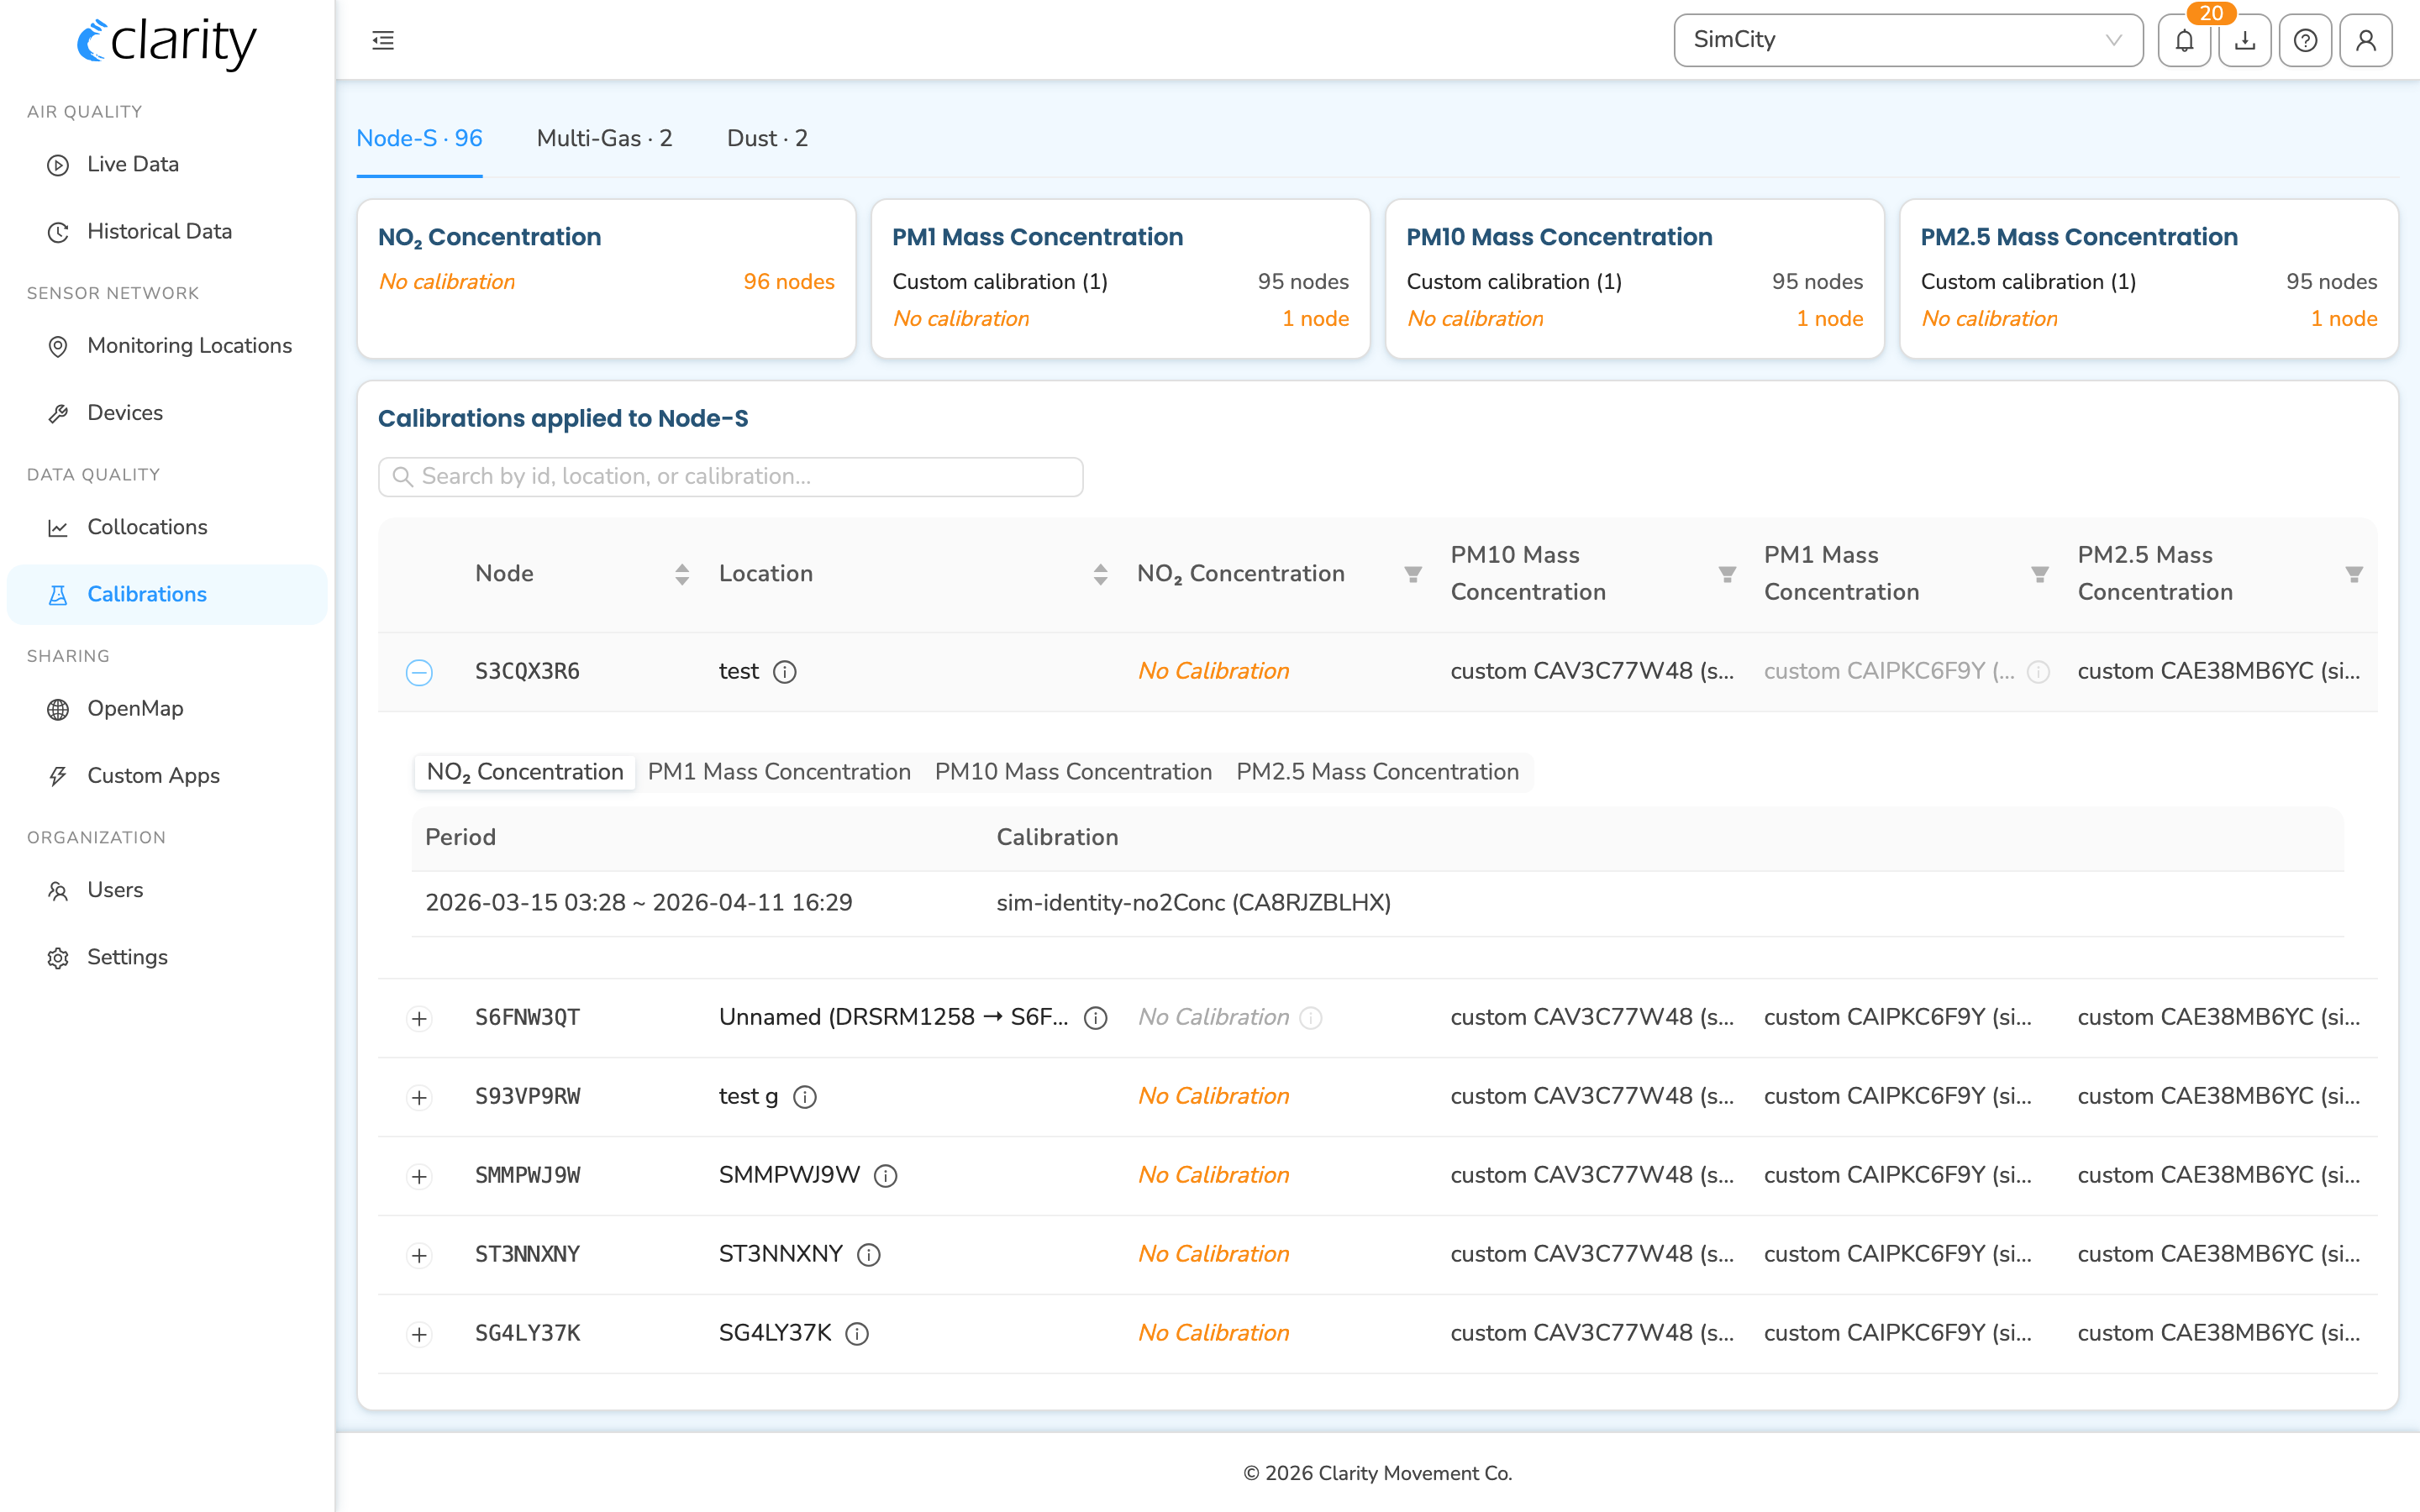
Viewing a device's calibration history
To see the calibration history for a particular device, click its row in the table. The row expands in place to reveal that device's history, inline beneath the row you clicked. Only one device's history is open at a time, and clicking the row again collapses it.
In the expanded area:
- If the device measures more than one parameter, use the parameter picker (the small segmented control at the top of the expanded area) to switch between parameters.
- The Period / Calibration table lists each calibration that has been applied and the time window it covered. The currently-applied calibration shows "Present" as its end. Timestamps render in your local time; hover a timestamp to see Local / Network / UTC equivalents.
If a device has no calibratable metrics (or no history yet for the selected parameter), the expanded area says so instead of showing an empty table.
What's next
- Understand what R² and RMSE mean.
- Know when to recalibrate or replace your Node-S.
- Collocate your device with a reference monitor.
- See calibration details by pollutant.
Was this article helpful?
Yes, thanks! / Not really
Still need a hand? Email us at support@clarity.io or create a support ticket, and our team will get back to you.